ВУЗ: Не указан
Категория: Не указан
Дисциплина: Не указана
Добавлен: 02.10.2020
Просмотров: 1298
Скачиваний: 6
©2002 CRC Press LLC
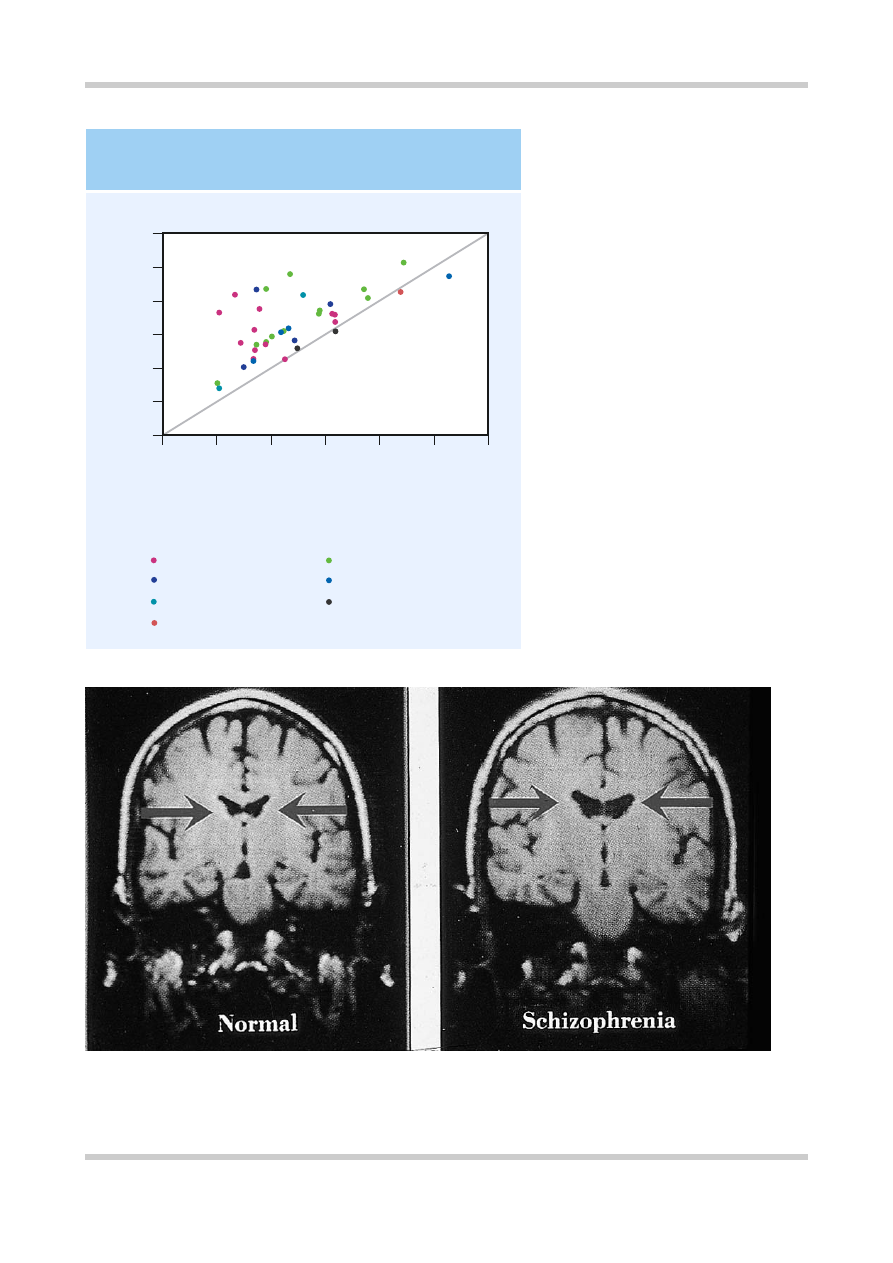
Figure 3.2
Mean ventricle : brain ratio (VBR)
in controls and patients with schizophrenia
from a total of 39 separate studies. The
diagonal line indicates the line of equality.
Thus, this figure demonstrates that no matter
which diagnostic system or method of
measuring brain volume is used, patients
with schizophrenia do have larger ventricles
than controls. Figure reproduced with
permission from Van Horn JD, McManus IC.
Ventricular enlargement in schizophrenia. A
meta-analysis of studies of the ventricle :
brain ration (VBR).
Br J Psychiatry
1992;160:687–97
12
2
4
6
8
10
10
0
Schizoph
renic mean VBR
12
Control mean VBR
8
6
4
2
0
DSM–III
RDC
DSM–III/RDC
WUC
DSM–III
RDC
DSM–III/RDC
Line of equality
Diagnostic criteria and methods of measurement:
INCREASED VENTRICLE VOLUME
IN SCHIZOPHRENIA
Planimetry
Computerized
Figure 3.3
Ventricular size in monozygotic twins discordant for schizophrenia. Coronal magnetic resonance images
of twins discordant for schizophrenia show lateral ventricular enlargement in the affected twin. Figure reproduced with
permission from Suddath RL, Christison GW, Torrey EF,
et al
. Anatomical abnormalities in the brains of monozygotic
twins discordant for schizophrenia.
N Engl J Med
1990;322:789–4

©2002 CRC Press LLC
Figure 3.4
Meta-analysis of absolute regional brain volumes in schizophrenic patients and controls, from a total of 58 studies.
This figure shows how the mean volumes of different brain regions from people with schizophrenia differ from those of
controls. Figure reproduced with permission from Wright IC, Rabe-Hesketh S, Woodruff PW,
et al
. Meta-analysis of regional
brain volumes in schizophrenia.
Am J Psychiatry
2000;157:16–25
Ventricular structures
Left lateral ventricle
Right lateral ventricle
Left frontal horn
Right frontal horn
Left body ventricle
Right body ventricle
Left occipital horn
Right occipital horn
Left temporal horn
Right temporal horn
Third ventricle
Fourth ventricle
Total ventricles
Cortical/limbic structures
Left hemisphere
Right hemisphere
Left frontal volume
Right frontal volume
Left temporal lobe
Right temporal lobe
Left amygdala
Right amygdala
Left hippocampus-amygdala
Right hippocampus-amygdala
Left hippocampus
Right hippocampus
Left parahippocampus
Right parahippocampus
Left superior temporal gyrus
Right superior temporal gyrus
Left anterior superior temporal gyrus
Right anterior superior temporal gyrus
Left posterior superior temporal gyrus
Right posterior superior temporal gyrus
Whole brain
Subcortical structures
Left caudate
Right caudate
Left putamen
Right putamen
Left globus pallidus
Right globus pallidus
Left thalamus
Right thalamus
Whole brain gray/white matter
Gray matter
White matter
Comparative mean volume of subjects with schizophrenia (%)
80 100 120
90 110
130 140 150 160 170
180
COMPARATIVE MEAN VOLUMES OF BRAIN REGIONS IN SCHIZOPHRENIA

©2002 CRC Press LLC
hamartomas and arteriovenous malformations
occur with increased frequency in schizophrenia.
At the cellular level, various abnormalities in
cytoarchitecture have been reported in several
brain regions, although not all of these findings
have proved robust. However, evidence of
neuronal displacement (
Figure 3.7
) suggests the
possibility of some failure in neuronal migration, a
process that occurs mainly during the second
trimester of fetal development
4
.
Several findings weigh against the most likely
alternative of a neurodegenerative process. The
balance of evidence is that most of the brain
abnormalities seen in schizophrenia are present at
first onset and are non-progressive. Furthermore,
markers of neurodegeneration, such as proteins
associated with glial response are largely absent,
although there may be a small degree of
periventricular gliosis. Extracerebral markers of
abnormal fetal development provide indirect
support for the idea that aberrant neurodevelop-
ment is implicated in schizophrenia. Dermato-
glyphic abnormalities are thought to reflect fetal
maldevelopment and appear to be more common
in schizophrenia (
Figure 3.8
). Minor physical
anomalies also occur with greater frequency in
Figure 3.5
Some structural brain abnormalities possibly implicated in the pathogenesis of schizophrenia. Structural
abnormalities have been described in many brain areas, and at a variety of anatomical levels, from gross macroscopic
changes in whole brain volume, through to subtle cellular displacement or disorganization in the cortex. Increasingly, interest
has focused on the distribution of abnormalities, and their structural connectivity: thus, white matter myelination, as well as
cortical abnormalities, are targets of investigation
Enlarged lateral
ventricles
Abnormalities
of white matter
Reduced hippocampal
volume
Reduced brain
volume
Gyral
abnormalities
Cortical cellular
displacement
Blunted temporal horns
of lateral ventricles
STRUCTURAL BRAIN ABNORMALITIES IN SCHIZOPHRENIA
©2002 CRC Press LLC
schizophrenic patients compared with normal
controls.
FUNCTIONAL BRAIN IMAGING
Functional brain imaging studies have used
positron emission tomography (PET), single
photon emission tomography (SPET) and, more
recently, functional magnetic resonance imaging
techniques (fMRI) to investigate regional cerebral
blood flow (rCBF) and brain metabolism in
schizophrenia (
Figure 3.9
)
5
.
It was previously thought that a decrease in
frontal blood flow and metabolism (‘hypofronta-
lity’) was a constant feature of schizophrenia.
However, this now appears to be a function of the
cognitive load involved in the test that patients are
carrying out at the time. For example, activation
studies using ‘frontal’ tasks such as the Wisconsin
card sorting test have shown that healthy
volunteers increase blood flow to the dorsolateral
prefrontal cortex during the task, while this is not
apparent when schizophrenic patients perform
the task. Other studies using verbal fluency as an
activation task have found impaired frontal blood
flow in schizophrenic patients (
Figure 3.10
)
6
.
However, there are studies on both tasks that have
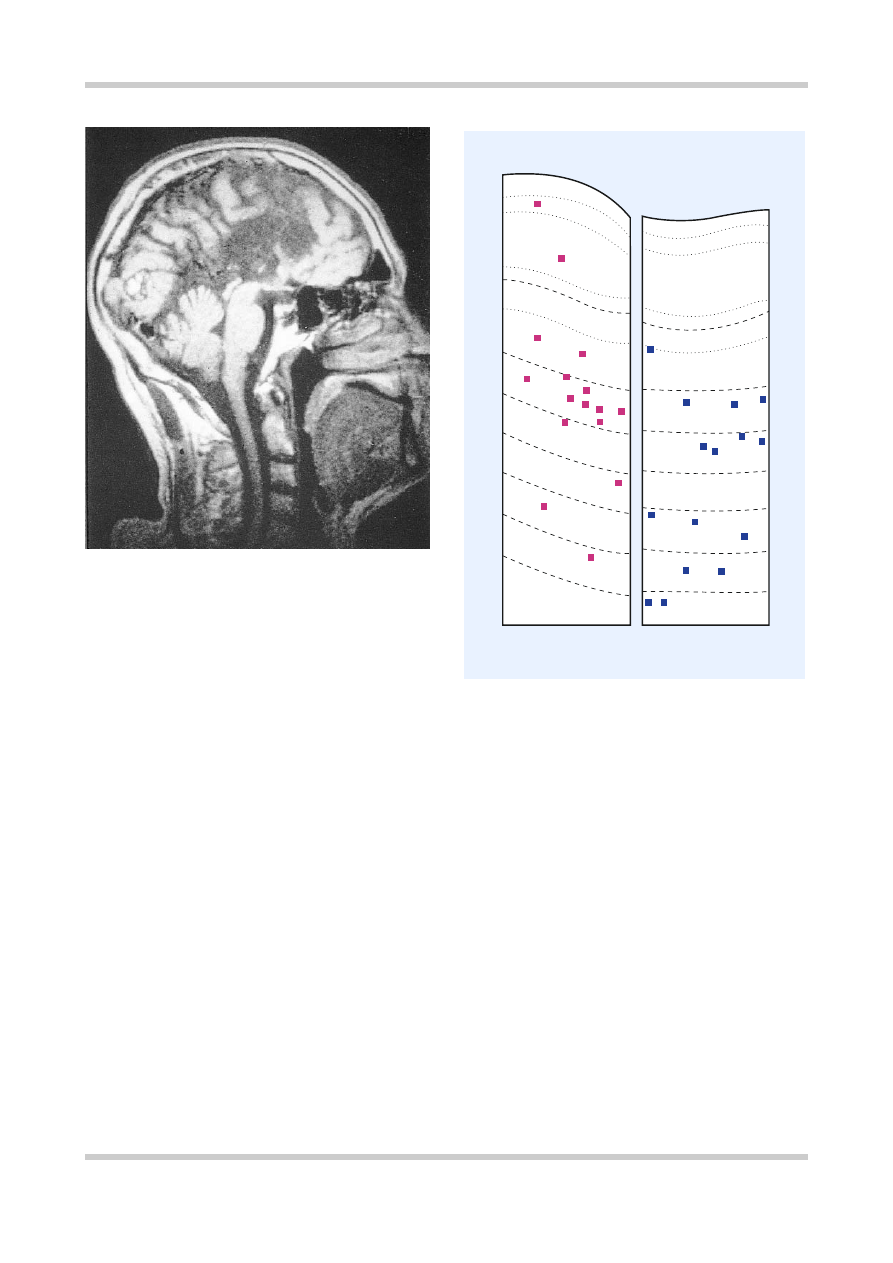
Figure 3.6
Agenesis of the corpus callosum. This midline
sagittal magnetic resonance image shows an absent corpus
callosum, a dramatic example of a neurodevelopmental
anomaly which, while extremely rare, is thought to have an
increased incidence in people with schizophrenia
Figure 3.7
These camera lucida drawings compare the
distribution of nicotinamide-adenine dinucleotide
phosphate-diaphorase-stained neurons (squares) in sections
through the superior frontal gyrus of a control and
schizophrenic brain. There is a significant shift in the
direction of the white matter in the schizophrenic brain.
Numbers 1 through 8 indicate compartments of the brain;
Roman numerals indicate cortical layers. Figure
reproduced with permission from Akbarian S, Bunney WE,
Jr, Potkin SG,
et al.
Altered distribution of nicotinamide-
adenine dinucleotide phosphate-diaphorase cells in frontal
lobe of schizophrenics implies disturbances of cortical
development.
Arch Gen Psychiatry
1993:50:169–77
3
2
1
4
5
6
7
8
Controls Schizophrenics
I
II
III
I
II
III
IV
IV
V
V
VI
VI
©2002 CRC Press LLC
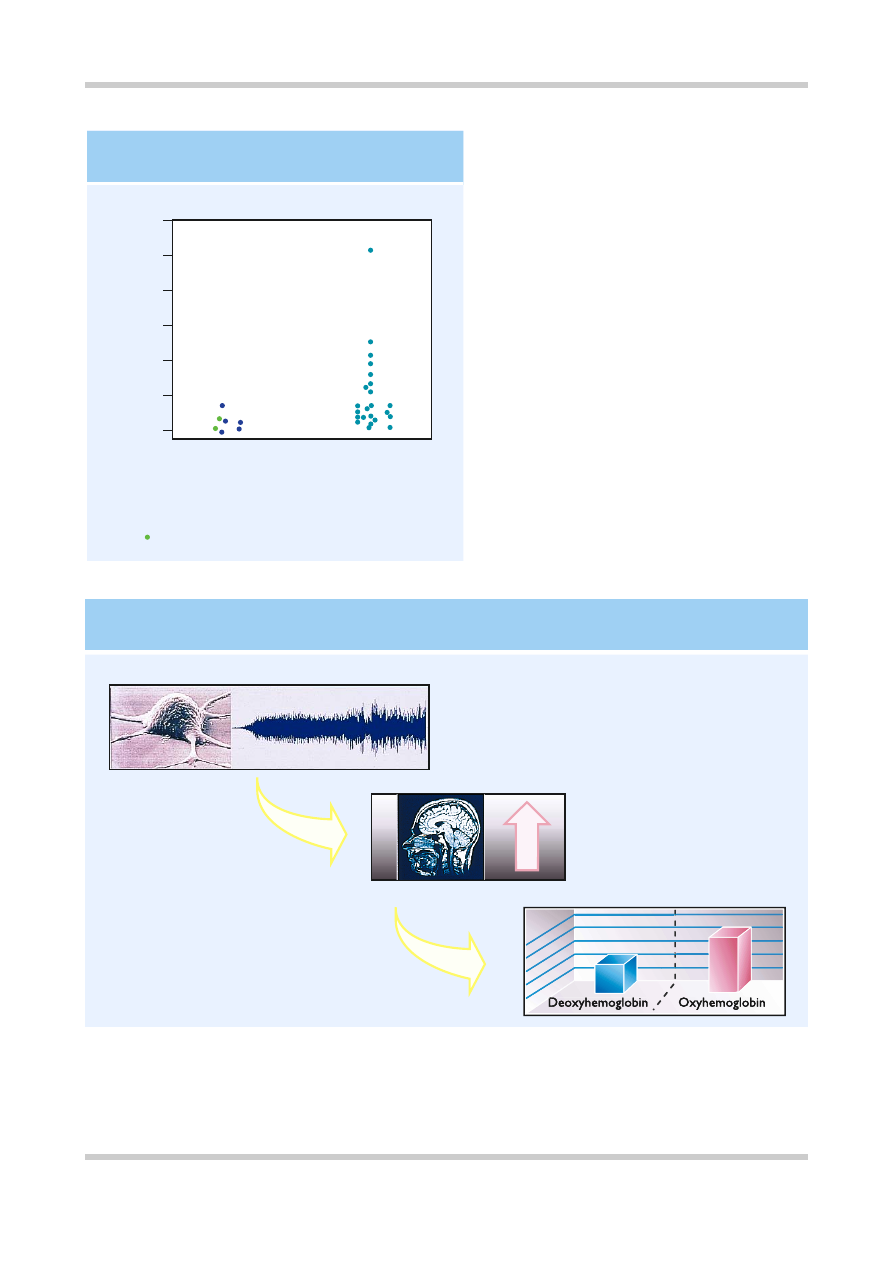
Figure 3.9
Oxyhemoglobin and deoxyhemoglobin have slightly different magnetic properties, and this is used as the basis
for the blood oxygenated level dependent (BOLD) method in functional magnetic resonance imaging (MRI). Increases in
neuronal activity are accompanied by increases in regional cerebral blood flow, which exceed the increase in cerebral
oxygen utilization. As a result the oxygen content of the venous blood is increased, leading to an increase in MRI signal
intensity. Figure reproduced with permission from Longworth C, Honey G, Sharma T. Science, medicine, and the future.
Functional magnetic resonance imaging in neuropsychiatry.
Br Med J
1999;319:1551–4
BASIS OF FUNCTIONAL MAGNETIC RESONANCE IMAGING
Change in blood oxygenation
D
Increased local cerebral blood flow
Neuronal activity
Figure 3.8
Structural abnormalities may be found in
schizophrenia outside the CNS; other structures that
develop at the same time may also be involved. In
monozygotic twins there should be little or no
difference between the twins in total finger ridge
count. It can be seen, however, that in twin pairs
where one twin suffers from schizophrenia, there is a
much greater difference in total finger ridge count.
This is significant because finger ridges develop in the
second trimester and therefore the differences
illustrated in this slide may indicate a degree of
maldevelopment in affected twins
60
10
20
30
40
50
0
Absolute intrapair diffe
rence
in total ridge count
Monozygotic twin pairs
Nonschizophrenic
(n = 7)
Discordant for
schizophrenia
(
n
= 23)
Pair discordant for depression
DERMATOGLYPHIC ABNORMALITIES
IN SCHIZOPHRENIA