ВУЗ: Не указан
Категория: Не указан
Дисциплина: Не указана
Добавлен: 02.04.2021
Просмотров: 344
Скачиваний: 1

Page 40 of 57
Accepted Manuscript
40
Table 3:
Parameter values after optimization of the point defect model on the experimental
impedance data for iron in borate buffer solution [0.3 M
H
3
BO
3
+ 0.075 M
Na
2
B
4
O
7
] + 0.001 M
EDTA
[Ethylenediaminetetraacetic acid,
EDTA
, disodium salt], at T=21
o
C.
pH=8.15
E
app
vs SHE/V
0.044
0.244
0.544
0.844
Average
Current density (A cm
-2
)
1.28×10
-6
1.81×10
-6
5.20×10
-7
4.75×10
-7
------------
Thickness of barrier layer (nm) 0.86
1.00
1.57
1.73
------------
CPE-Y
(S s
α
cm
-2
)
1.94×10
-5
1.25×10
-5
4.67×10
-6
5.30×10
-6
------------
CPE-
α
0.94
0.95
0.94
0.96
------------
Electric field (ε)
3×10
6
3×10
6
3×10
6
3×10
6
assumed
Warburg coefficient (σ)
1.97×10
5
7.38×10
5
1.61×10
6
6.09×10
5
------------
D
i
(cm
2
s
-1
)
1.08×10
-15
3.03×10
-14
1.18×10
-14
1.42×10
-14
------------
Polarizability of the BOI (α)
0.724
0.724
0.724
0.724
0.724
Transfer coeff. reaction 1 (α
2
)
0.01
0.003
0.02
0.01
0.01
Transfer coeff. reaction 2 (α
3
)
0.19
0.17
0.18
0.17
0.17
k
0
2
(mol cm
-2
s
-1
)
3.88×10
-12
5.95×10
-12
1.68×10
-12
1.54×10
-12
3.2×10
-12
k
0
3
(mol cm
-2
s
-1
)
4.98×10
-16
4.47×10
-16
8.85×10
-16
5.03×10
-16
5.8×10
-16
k
0
7
(mol cm
-2
s
-1
)
5.52×10
-12
6.68×10
-12
1.99×10
-12
2.49×10
-12
5.5×10
-12
R
s
(ohm cm
2
)
36
34.6
34.6
34.7
------------
Φ
0
f/s
-0.1
-0.1
-0.1
-0.1
assumed
β
-0.03
-0.03
-0.03
-0.03
assumed
C
dl
(F cm
-2
)
1.16×10
-6
1.63×10
-6
4.25×10
-6
1.26×10
-6
------------
R
ct
(ohm cm
2
)
3.46×10
9
2.96×10
9
3.86×10
9
2.97×10
9
------------
pH=10
E
app
vs SHE/V
0.044
0.244
0.544
0.844
Average
Current density (A cm
-2
)
3.42×10
-7
5.15×10
-7
7.62×10
-7
4.55×10
-7
-----------
Thickness of barrier layer (nm) 1.47
1.56
2.15
2.28
-----------
CPE-Y
(S s
α
cm
-2
)
1.79×10
-5
1.21×10
-5
7.60×10
-6
6.15×10
-6
-----------
CPE-
α
0.94
0.96
0.96
0.94
-----------
Electric field (ε)
3×10
6
3×10
6
3×10
6
3×10
6
assumed
Warburg coefficient (σ)
1.32×10
5
7.54×10
4
1.40×10
5
1.35×10
5
-----------
D
i
(cm
2
s
-1
)
3.47×10
-17
2.55×10
-17
1.94×10
-16
6.42×10
-17
-----------
Polarizability of the BOI (α)
0.724
0.724
0.724
0.724
0.724
Transfer coeff. reaction 1 (α
2
)
0.02
0.01
0.005
0.01
0.01
Transfer coeff. reaction 2 (α
3
)
0.11
0.14
0.11
0.19
0.13
k
0
2
(mol cm
-2
s
-1
)
1.30×10
-12
1.78×10
-12
2.80×10
-12
1.68×10
-12
1.89×10
-12
k
0
3
(mol cm
-2
s
-1
)
2.03×10
-16
2.69×10
-16
1.78×10
-16
7.16×10
-16
3.41×10
-16
k
0
7
(mol cm
-2
s
-1
)
3.35×10
-12
4.64×10
-12
1.27×10
-12
2.12×10
-12
2.84×10
-12
R
s
(ohm cm
2
)
31.5
31.5
34.6
32
-----------
Φ
0
f/s
-0.1
-0.1
-0.1
-0.1
assumed
β
-0.03
-0.03
-0.03
-0.03
assumed
C
dl
(F cm
-2
)
2.19×10
-7
8.04×10
-7
4.89×10
-7
2.35×10
-7
-----------
R
ct
(ohm cm
2
)
3.54×10
9
3.22×10
9
3.68×10
9
3.76×10
9
-----------

Page 41 of 57
Accepted Manuscript
41
Figure Captions
Figure 1
. Interfacial defect generation/annihilation reactions that are postulated to occur in the
growth of anodic barrier oxide films according to the Point Defect Model.
m
metal atom,
M
V
cation vacancy on the metal sublattice of the barrier layer,
i
M
interstitial cation,
M
M
metal
cation on the metal sublattice of the barrier layer,
O
V
oxygen vacancy on the oxygen
sublattice of the barrier layer,
O
O
oxygen anion on the oxygen sublattice of the barrier layer,
M
metal cation in solution.
Figure 2.
Equivalent electrical circuit describing the total impedance of the system
Figure 3.
Randles equivalent electrical circuit describing the impedance of the redox reaction
that accepts the electronic charge from the barrier layer. Here
W
z
– is the solution-based Warburg
impedance,
R
ct
is the charge transfer resistance of electrochemical cathodic reaction (e.g.,
hydrogen evolution) and
C
dl
is the capacity of the double layer.
Figure 4.
Nyquist plot for parallel impedance for the case for iron in borate buffer solution [0.3
M
H
3
BO
3
+ 0.075 M
Na
2
B
4
O
7
] + 0.001 M
EDTA
[Ethylenediaminetetraacetic acid,
EDTA
,
disodium salt],
pH
=8.15,
T
= 21
o
C and
E
= 0.044 V (
SHE
).
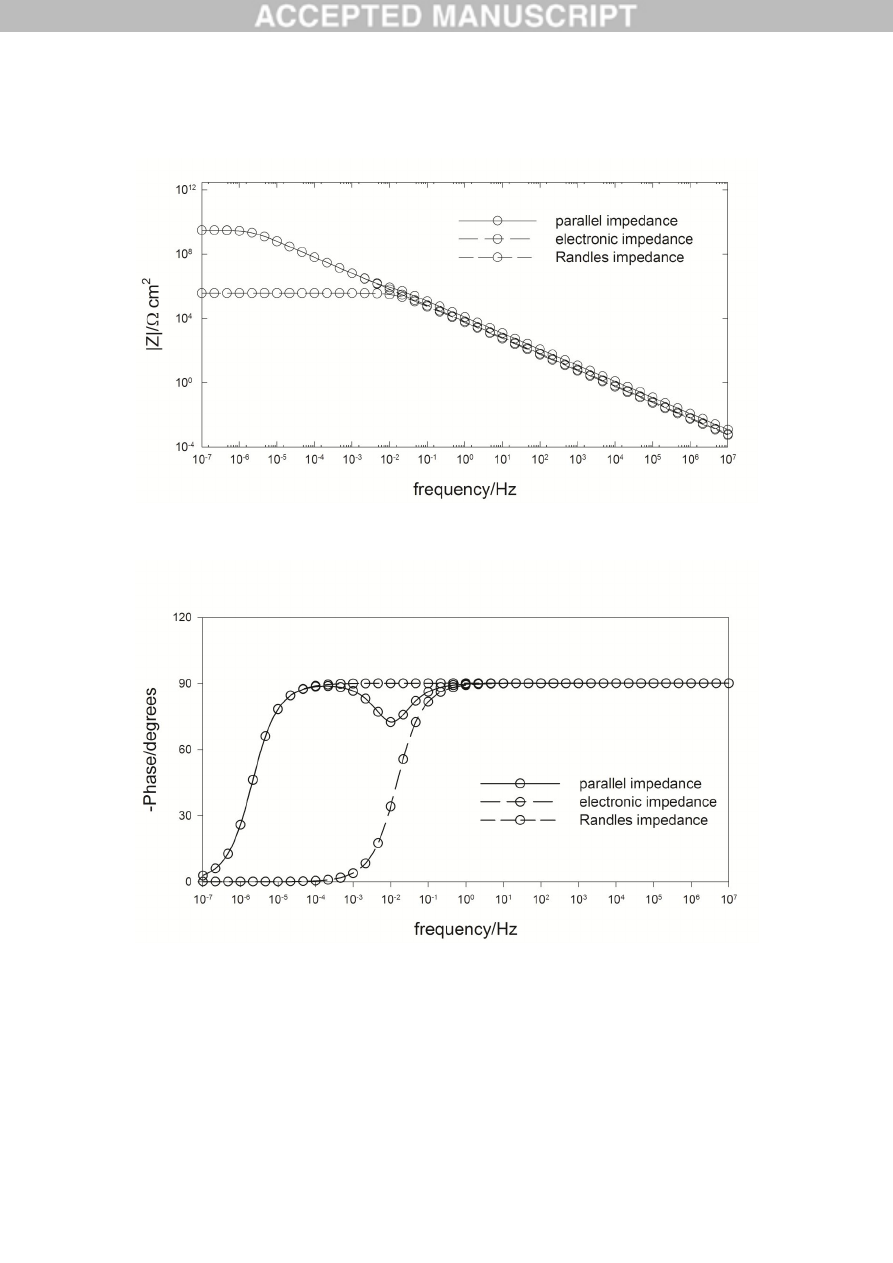
Figure 5.
Bode plot (magnitude of the impedance) for the case for iron in borate buffer solution
[0.3 M
H
3
BO
3
+ 0.075 M
Na
2
B
4
O
7
] + 0.001 M
EDTA
, pH=8.15,
T
= 21
o
C, and
E
= 0.044 V
(
SHE
).
Figure 6.
Bode plot (phase angle) for the case for iron in borate buffer solution [0.3 M
H
3
BO
3
+
0.075 M
Na
2
B
4
O
7
] + 0.001 M
EDTA
,
pH
=8.15,
T
= 21
o
C and
E
= 0.044 V (SHE).
Figure 7.
Experimental and simulated impedance spectra for iron in borate buffer solution [0.3
M
H
3
BO
3
+ 0.075 M
Na
2
B
4
O
7
, as appropriate] + 0.001 M
EDTA
[Ethylenediaminetetraacetic
acid, disodium salt], (a) pH = 8.15 and (b)10, T=21
o
C as a function of applied potential, solid
lines show the best fit calculation according to PDM.
Figure 8. C
omparison of obtained kinetic parameters from PDM optimization as a function of
applied potential (a) standard rate constants (pH=8.15), (b) transfer coefficients (pH=8.15), (c)
standard rate constants (pH=10.0) and (d) transfer coefficients (pH=10.0) (Lines are showing the
linear regressions).
Figure 9.
Comparison between the experimental and calculated steady-state data (a) current
density (pH=8.15), (b) barrier layer thickness (pH=8.15), (c) current density (pH=10.0) and (d)
barrier layer thickness (pH=10.0) (Lines are showing the linear regressions).
Figure 10.
Calculated diffusivity of iron interstitials as a function of potential,
T
= 22
o
C(Lines
are showing the linear regressions).

Page 42 of 57
Accepted Manuscript
42
Metal
Barrier Oxide Layer
Outer Layer/Solution
(1)
e
v
M
V
m
m
M
k
M
1
(4)
e
V
M
M
M
k
M
)
(
4
| |
(2)
e
v
M
m
m
i
k
2
(5)
e
M
M
k
i
)
(
5
| |
(3)
e
V
2
M
m
..
O
M
k
3
(6)
H
2
O
O
H
V
O
k
2
..
O
6
| |
(7)
e
O
H
M
H
MO
k
)
(
2
2
2
/
7
| |
(
x = L
) (
x = 0
)
Fig. 1

Page 43 of 57
Accepted Manuscript
43
Fig.2
Fig.3
Fig.4
Page 44 of 57
Accepted Manuscript
44
Fig.5
Fig.6