ВУЗ: Казахская Национальная Академия Искусств им. Т. Жургенова
Категория: Книга
Дисциплина: Не указана
Добавлен: 03.02.2019
Просмотров: 21787
Скачиваний: 19

The Physical Nature of Sound 1-11
1.1.2a
Complex Sounds
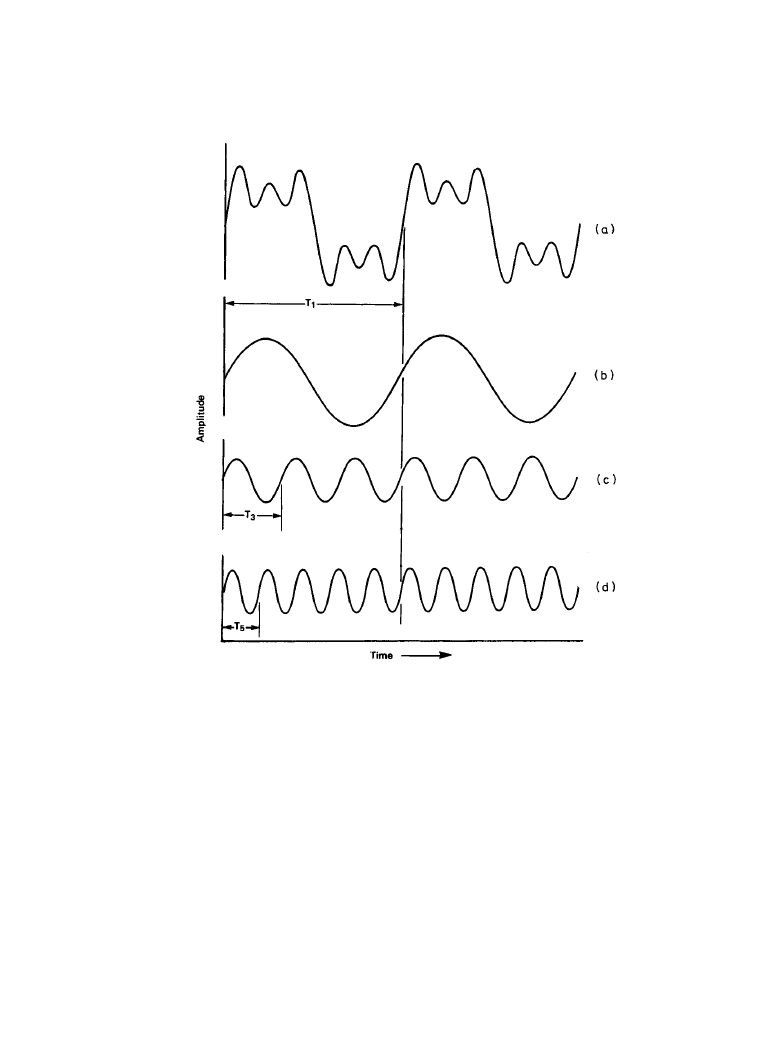
The simple sine waves used for illustration reveal their periodicity very clearly. Normal sounds,
however, are much more complex, being combinations of several such pure tones of different fre-
quencies and perhaps additional transient sound components that punctuate the more sustained
elements. For example, speech is a mixture of approximately periodic vowel sounds and staccato
consonant sounds. Complex sounds can also be periodic; the repeated wave pattern is just more
intricate, as is shown in Figure 1.l.4a. The period identified as T
1
applies to the fundamental fre-
quency of the sound wave, the component that normally is related to the characteristic pitch of
the sound. Higher-frequency components of the complex wave are also periodic, but because
they are typically lower in amplitude, that aspect tends to be disguised in the summation of sev-
eral such components of different frequency. If, however, the sound wave were analyzed, or bro-
ken down into its constituent parts, a different picture emerges: Figure 1.l.4b, c, and d. In this
example, the analysis shows that the components are all harmonics, or whole-number multiples,
of the fundamental frequency; the higher-frequency components all have multiples of entire
cycles within the period of the fundamental.
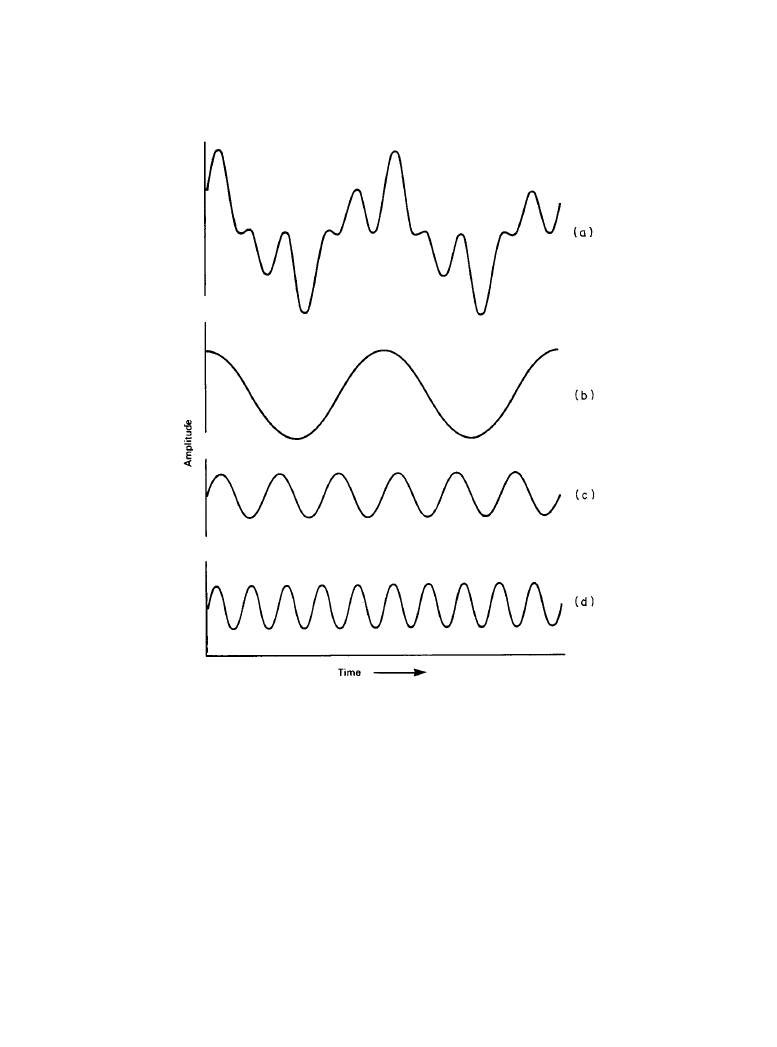
To generalize, it can be stated that all complex periodic waveforms are combinations of sev-
eral harmonically related sine waves. The shape of a complex waveform depends upon the rela-
tive amplitudes of the various harmonics and the position in time of each individual component
with respect to the others. If one of the harmonic components in Figure 1.1.4 is shifted slightly in
time, the shape of the waveform is changed, although the frequency composition remains the
same (Figure 1.1.5). Obviously a record of the time locations of the various harmonic compo-
nents is required to completely describe the complex waveform. This information is noted as the
phase of the individual components.
1.1.2b
Phase
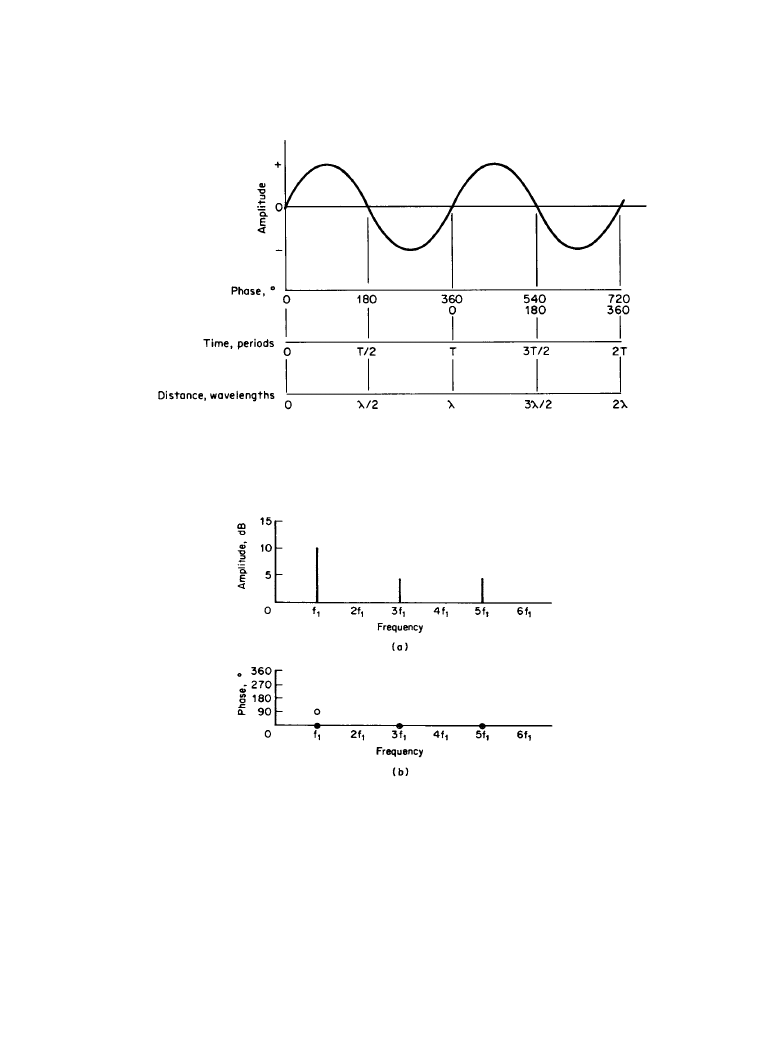
Phase is a notation in which the time of one period of a sine wave is divided into 360°. It is a rel-
ative quantity, and although it can be defined with respect to any reference point in a cycle, it is
convenient to start (0°) with the upward, or positive-going, zero crossing and to end (360°) at
precisely the same point at the beginning of the next cycle (Figure 1.1.6). Phase shift expresses
in degrees the fraction of a period or wavelength by which a single-frequency component is
shifted in the time domain. For example, a phase shift of 90° corresponds to a shift of one-fourth
period. For different frequencies this translates into different time shifts. Looking at it from the
other point of view, if a complex waveform is time-delayed, the various harmonic components
will experience different phase shifts, depending on their frequencies.
A special case of phase shift is a polarity reversal, an inversion of the waveform, where all
frequency components undergo a 180° phase shift. This occurs when, for example, the connec-
tions to a loudspeaker are reversed.
1.1.2c
Spectra
Translating time-domain information into the frequency domain yields an amplitude-frequency
spectrum or, as it is commonly called, simply a spectrum. Figure 1.1.7a shows the spectrum of
the waveform in Figures 1.1.4 and 1.1.5, in which the height of each line represents the ampli-
tude of that particular component and the position of the line along the frequency axis identifies
its frequency. This kind of display is a line spectrum because there are sound components at only
Downloaded from Digital Engineering Library @ McGraw-Hill (www.digitalengineeringlibrary.com)
Copyright © 2004 The McGraw-Hill Companies. All rights reserved.
Any use is subject to the Terms of Use as given at the website.
The Physical Nature of Sound
1-12 Principles of Sound and Hearing
certain specific frequencies. The phase information is shown in Figure 1.l.7b, where the differ-
ence between the two waveforms is revealed in the different phase-frequency spectra.
The equivalence of the information presented in the two domains—the waveform in the time
domain and the amplitude- and phase-frequency spectra in the frequency domain—is a matter of
considerable importance. The proofs have been thoroughly worked out by the French mathemati-
cian Fourier, and the well-known relationships bear his name. The breaking down of waveforms
into their constituent sinusoidal parts is known as Fourier analysis. The construction of complex
Figure 1.1.4
A complex waveform constructed from the sum of three harmonically related sinuso-
idal components, all of which start at the origin of the time scale with a positive-going zero cross-
ing. Extending the series of odd-harmonic components to include those above the fifth would
result in the complex waveform progressively assuming the form of a square wave. (
a) Complex
waveform, the sum of
b, c, and d. (b) Fundamental frequency. (c) Third harmonic. (d) Fifth har-
monic.
Downloaded from Digital Engineering Library @ McGraw-Hill (www.digitalengineeringlibrary.com)
Copyright © 2004 The McGraw-Hill Companies. All rights reserved.
Any use is subject to the Terms of Use as given at the website.
The Physical Nature of Sound
The Physical Nature of Sound 1-13
waveshapes from summations of sine waves is called Fourier synthesis. Fourier transformations
permit the conversion of time-domain information into frequency-domain information, and vice
versa. These interchangeable descriptions of waveforms form the basis for powerful methods of
measurement and, at the present stage, provide a convenient means of understanding audio phe-
nomena. In the examples that follow, the relationships between time-domain and frequency-
domain descriptions of waveforms will be noted.
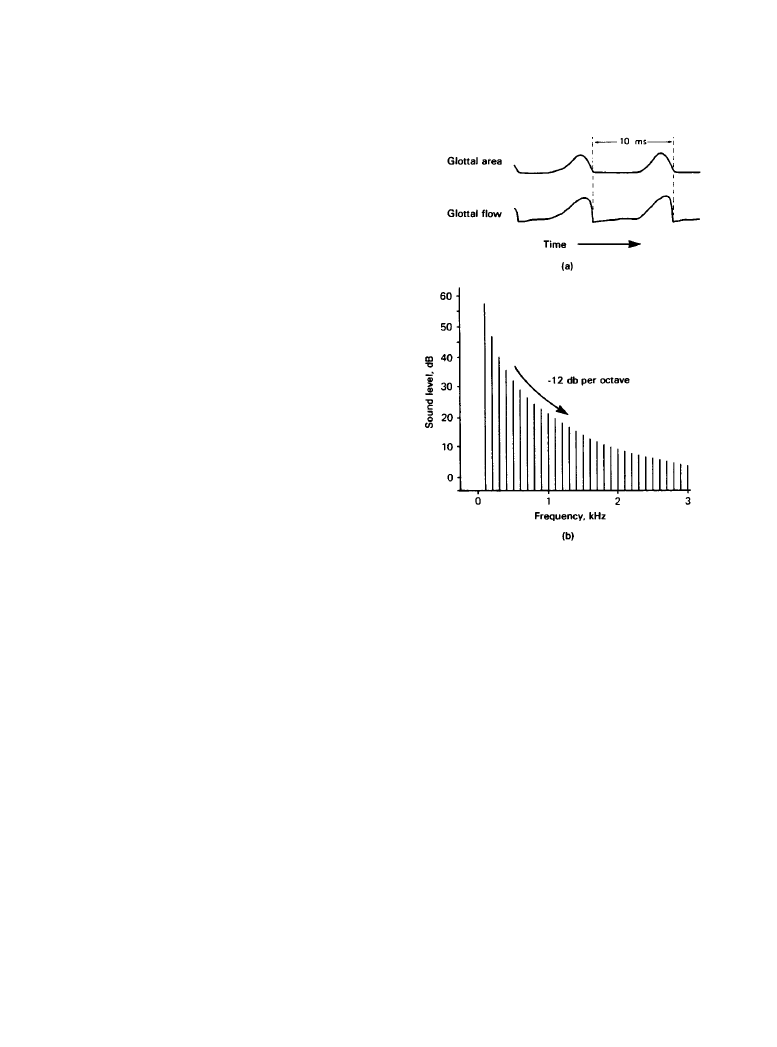
Figure 1.1.8 illustrates the sound waveform that emerges from the larynx, the buzzing sound
that is the basis for vocalized speech sounds. This sound is modified in various ways in its pas-
sage down the vocal tract before it emerges from the mouth as speech. The waveform is a series
Figure 1.1.5
A complex waveform with the same harmonic-component amplitudes as in Figure
1.1.4, but with the starting time of the fundamental advanced by one-fourth period: a phase shift of
90°.
Downloaded from Digital Engineering Library @ McGraw-Hill (www.digitalengineeringlibrary.com)
Copyright © 2004 The McGraw-Hill Companies. All rights reserved.
Any use is subject to the Terms of Use as given at the website.
The Physical Nature of Sound
1-14 Principles of Sound and Hearing
Figure 1.1.6
The relationship between the period
T and wavelength
λ
of a sinusoidal waveform
and the phase expressed in degrees. Although it is normal to consider each repetitive cycle as an
independent 360°, it is sometimes necessary to sum successive cycles starting from a reference
point in one of them.
Figure 1.1.7
The amplitude-frequency spectra (
a) and the phase-frequency spectra (b) of the
complex waveforms shown in Figures 1.1.4 and 1.1.5. The amplitude spectra are identical for both
waveforms, but the phase-frequency spectra show the 90° phase shift of the fundamental compo-
nent in the waveform of Figure 1.1.5. Note that frequency is expressed as a multiple of the funda-
mental frequency
f
1
. The numerals are the harmonic numbers. Only the fundamental
f
1
and the
third and fifth harmonics (
f
3
and
f
5
) are present.
Downloaded from Digital Engineering Library @ McGraw-Hill (www.digitalengineeringlibrary.com)
Copyright © 2004 The McGraw-Hill Companies. All rights reserved.
Any use is subject to the Terms of Use as given at the website.
The Physical Nature of Sound
The Physical Nature of Sound 1-15
of periodic pulses, corresponding to the pulses of air that are expelled, under lung pressure, from
the vibrating vocal cords. The spectrum of this waveform consists of a harmonic series of com-
ponents, with a fundamental frequency, for this male talker, of 100 Hz. The gently rounded con-
tours of the waveform suggest the absence of strong high-frequency components, and the
amplitude-frequency spectrum confirms it. The spectrum envelope, the overall shape delineating
the amplitudes of the components of the line spectrum, shows a progressive decline in amplitude
as a function of frequency. The amplitudes are described in decibels, abbreviated dB. This is the
common unit for describing sound-level differences. The rate of this decline is about –12 dB per
octave (an octave is a 2:1 ratio of frequencies).
Increasing the pitch of the voice brings the pulses closer together in time and raises the funda-
mental frequency. The harmonic-spectrum lines displayed in the frequency domain are then
spaced farther apart but still within the overall form of the spectrum envelope, which is defined
by the shape of the pulse itself. Reducing the pitch of the voice has the opposite effect, increasing
the spacing between pulses and reducing the spacing between the spectral lines under the enve-
lope. Continuing this process to the limiting condition, if it were possible to emit just a single
pulse, would be equivalent to an infinitely long period, and the spacing between the spectral lines
would vanish. The discontinuous, or aperiodic, pulse waveform therefore yields a continuous
spectrum having the form of the spectrum envelope.
Isolated pulses of sound occur in speech as any of the variations of consonant sounds and in
music as percussive sounds and as transient events punctuating more continuous melodic lines.
All these aperiodic sounds exhibit continuous spectra with shapes that are dictated by the wave-
Figure 1.1.8
Characteristics of speech. (
a)
Waveforms showing the varying area
between vibrating vocal cords and the corre-
sponding airflow during vocalized speech as
a function of time. (
b) The corresponding
amplitude-frequency spectrum, showing the
100-Hz fundamental frequency for this male
speaker. (
From [3]. Used with permission.)
Downloaded from Digital Engineering Library @ McGraw-Hill (www.digitalengineeringlibrary.com)
Copyright © 2004 The McGraw-Hill Companies. All rights reserved.
Any use is subject to the Terms of Use as given at the website.
The Physical Nature of Sound