ВУЗ: Казахская Национальная Академия Искусств им. Т. Жургенова
Категория: Книга
Дисциплина: Не указана
Добавлен: 03.02.2019
Просмотров: 21567
Скачиваний: 19

1-16 Principles of Sound and Hearing
forms. The leisurely undulations of a bass drum waveform contain predominantly low-frequency
energy, just as the more rapid pressure changes in a snare drum waveform require the presence of
higher frequencies with their more rapid rates of change. A technical waveform of considerable
use in measurements consists of a very brief impulse which has the important feature of contain-
ing equal amplitudes of all frequencies within the audio-frequency bandwidth. This is moving
toward a limiting condition in which an infinitely short event in the time domain is associated
with an infinitely wide amplitude-frequency spectrum.
1.1.3
Dimensions of Sound
The descriptions of sound in the preceding section involved only pressure variation, and while
this is the dimension that is most commonly referred to, it is not the only one. Accompanying the
pressure changes are temporary movements of the air “particles” as the sound wave passes (in
this context a particle is a volume of air that is large enough to contain many molecules while its
dimensions are small compared with the wavelength). Other measures of the magnitude of the
sound event are the displacement amplitude of the air particles away from their rest positions and
the velocity amplitude of the particles during the movement cycle. In the physics of sound, the
particle displacement and the particle velocity are useful concepts, but the difficulty of their
measurement limits their practical application. They can, however, help in understanding other
concepts.
In a normally propagating sound wave, energy is required to move the air particles; they must
be pushed or pulled against the elasticity of the air, causing the incremental rises and falls in
pressure. Doubling the displacement doubles the pressure change, and this requires double the
force. Because the work done is the product of force times distance and both are doubled, the
energy in a sound wave is therefore proportional to the square of the particle displacement ampli-
tude or, in more practical terms, to the square of the sound pressure amplitude.
Sound energy spreads outward from the source in the three dimensions of space, in addition
to those of amplitude and time. The energy of such a sound field is usually described in terms of
the energy flow through an imaginary surface. The sound energy transmitted per unit of time is
called sound power. The sound power passing through a unit area of a surface perpendicular to a
specified direction is called the sound intensity. Because intensity is a measure of energy flow, it
also is proportional to the square of the sound pressure amplitude.
The ear responds to a very wide range of sound pressure amplitudes. From the smallest sound
that is audible to sounds large enough to cause discomfort there is a ratio of approximately 1 mil-
lion in sound pressure amplitude, or 1 trillion (10
12
) in sound intensity or power. Dealing rou-
tinely with such large numbers is impractical, so a logarithmic scale is used. This is based on the
bel, which represents a ratio of 10:1 in sound intensity or sound power (the power can be acousti-
cal or electrical). More commonly the decibel, one-tenth of a bel, is used. A difference of 10 dB
therefore corresponds to a factor-of-10 difference in sound intensity or sound power. Mathemati-
cally this can be generalized as
(1.1.5)
or
Level difference
log
P
1
P
2
------ bels
=
Downloaded from Digital Engineering Library @ McGraw-Hill (www.digitalengineeringlibrary.com)
Copyright © 2004 The McGraw-Hill Companies. All rights reserved.
Any use is subject to the Terms of Use as given at the website.
The Physical Nature of Sound
The Physical Nature of Sound 1-17
Level difference
(1.1.6)
where P
1
and P
2
are two levels of power.
For ratios of sound pressures (analogous to voltage or current ratios in electrical systems) the
squared relationship with power is accommodated by multiplying the logarithm of the ratio of
pressures by 2, as follows:
(1.1.7)
where P1 and P2 are sound pressures.
10
=
log
P
1
P
2
------ decibels
Level difference
10 log
P
1
2
P
2
2
------
20 log
p
1
p
2
----- dB
=
=
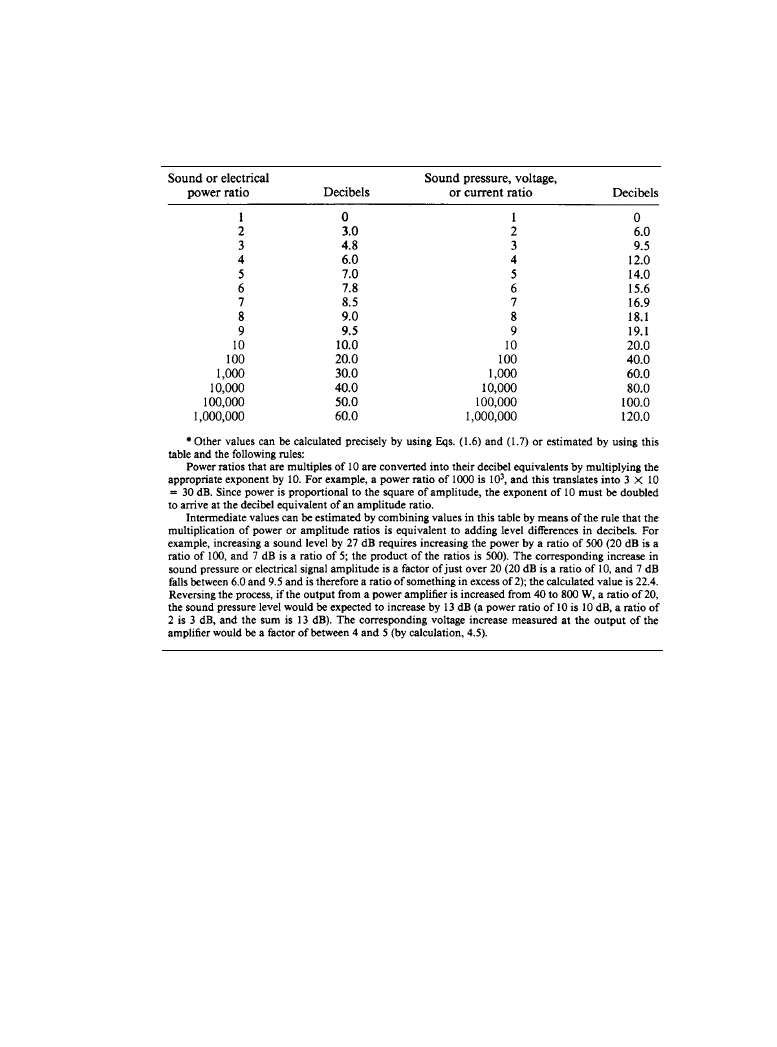
Table 1.1.1 Various Power and Amplitude Ratios and their Decibel Equivalents*
Downloaded from Digital Engineering Library @ McGraw-Hill (www.digitalengineeringlibrary.com)
Copyright © 2004 The McGraw-Hill Companies. All rights reserved.
Any use is subject to the Terms of Use as given at the website.
The Physical Nature of Sound
1-18 Principles of Sound and Hearing
The relationship between decibels and a selection of power and pressure ratios is given in
Table 1.1.1. The footnote to the table describes a simple process for interpolating between these
values, an exercise that helps to develop a feel for the meaning of the quantities.
The representation of the relative magnitudes of sound pressures and powers in decibels is
important, but there is no indication of the absolute magnitude of either quantity being com-
pared. This limitation is easily overcome by the use of a universally accepted reference level with
which others are compared. For convenience the standard reference level is close to the smallest
sound that is audible to a person with normal hearing. This defines a scale of sound pressure
level (SPL), in which 0 dB represents a sound level close to the hearing-threshold level for mid-
dle and high frequencies (the most sensitive range). The SPL of a sound therefore describes, in
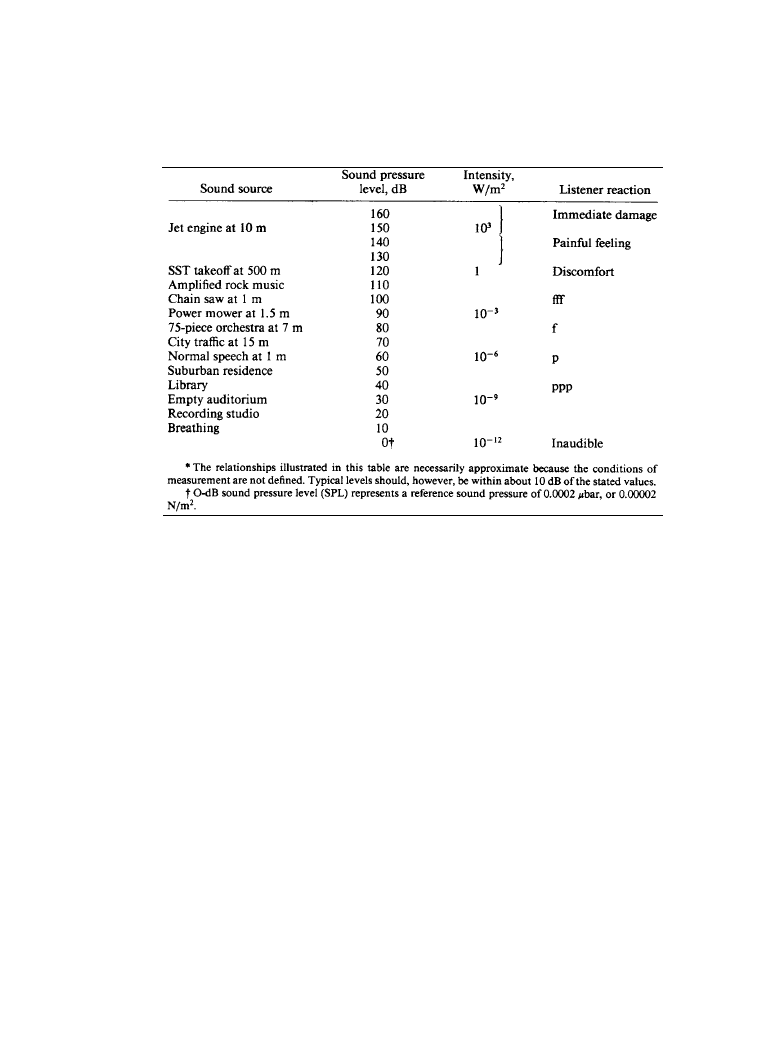
decibels, the relationship between the level of that sounds and the reference level. Table 1.1.2
gives examples of SPLs of some common sounds with the corresponding intensities and an indi-
cation of listener reactions. From this table it is clear that the musically useful range of SPLs
extend from the level of background noises in quiet surroundings to levels at which listeners
begin to experience auditory discomfort and nonauditory sensations of feeling or pain in the ears
themselves.
While some sound sources, such as chain saws and power mowers, produce a relatively con-
stant sound output, others, like a 75-piece orchestra, are variable. The sound from such an
orchestra might have a peak factor of 20 to 30 dB; the momentary, or peak, levels can be this
amount higher than the long-term average SPL indicated [4].
The sound power produced by sources gives another perspective on the quantities being
described. In spite of some impressively large sounds, a full symphony orchestra produces only
Table 1.1.2 Typical Sound Pressure Levels and Intensities for Various Sound Sources*
Downloaded from Digital Engineering Library @ McGraw-Hill (www.digitalengineeringlibrary.com)
Copyright © 2004 The McGraw-Hill Companies. All rights reserved.
Any use is subject to the Terms of Use as given at the website.
The Physical Nature of Sound

The Physical Nature of Sound 1-19
about 1 acoustic watt when working through a typical musical passage. On crescendos with per-
cussion, though, the levels can be of the order of 100 W. A bass drum alone can produce about 25
W of acoustic power of peaks. All these levels are dependent on the instruments and how they
are played. Maximum sound output from cymbals might be 10 W; from a trombone, 6 W; and
from a piano, 0.4 W [5]. By comparison, average speech generates about 25 µW, and a present-
day jet liner at takeoff between 50 and 100 kW. Small gasoline engines produce from 0.001 to 1.0
acoustic watt, and electric home appliances less than 0.01 W [6].
1.1.4
References
1.
Beranek, Leo L: Acoustics, McGraw-Hill, New York, N.Y., 1954.
2.
Wong, G. S. K.: “Speed of Sound in Standard Air,” J. Acoust. Soc. Am., vol. 79, pp. 1359–
1366, 1986.
3.
Pickett, J. M.: The Sounds of Speech Communications, University Park Press, Baltimore,
MD, 1980.
4.
Ehara, Shiro: “Instantaneous Pressure Distributions of Orchestra Sounds,” J. Acoust. Soc.
Japan, vol. 22, pp. 276–289, 1966.
5.
Stephens, R. W. B., and A. E. Bate: Acoustics and Vibrational Physics, 2nd ed., E. Arnold
(ed.), London, 1966.
6.
Shaw, E. A. G.: “Noise Pollution—What Can be Done?” Phys. Today, vol. 28, no. 1, pp.
46–58, 1975.
Downloaded from Digital Engineering Library @ McGraw-Hill (www.digitalengineeringlibrary.com)
Copyright © 2004 The McGraw-Hill Companies. All rights reserved.
Any use is subject to the Terms of Use as given at the website.
The Physical Nature of Sound

Downloaded from Digital Engineering Library @ McGraw-Hill (www.digitalengineeringlibrary.com)
Copyright © 2004 The McGraw-Hill Companies. All rights reserved.
Any use is subject to the Terms of Use as given at the website.
The Physical Nature of Sound