ВУЗ: Не указан
Категория: Не указан
Дисциплина: Не указана
Добавлен: 13.10.2020
Просмотров: 1633
Скачиваний: 1

Editorial and production team
The Global Report on Trafficking in Persons 2014 was prepared by the
UNODC Global Report on Trafficking in Persons Unit under the supervi-
sion of Angela Me, Chief of the Research and Trend Analysis Branch.
Core team
Kristiina Kangaspunta, Fabrizio Sarrica, Raggie Johansen.
Graphic design and layout
Suzanne Kunnen, Kristina Kuttnig.
Cartography
UNODC and Atelier de Cartographie de Sciences Po (Benoît Martin).
The Global Report on Trafficking in Persons Unit would like to thank the
UNODC Human Trafficking and Migrant Smuggling Section, as well as
the Unit’s former intern Kelsey McGregor Perry for their valuable inputs
and support.
The Global Report on Trafficking in Persons Unit would also like to thank
Sheldon X. Zhang of San Diego State University for reviewing and com-
menting upon draft Report content.
The report also benefited from the work and expertise of many other
UNODC staff members in Vienna and around the world.

3
CONTENTS
Core results
5
Executive summary
7
Introduction
15
Methodology
17
I.
GLOBAL OVERVIEW
TRAFFICKERS
23
TRAFFICKING VICTIMS
29
FORMS OF EXPLOITATION
33
TRAFFICKING FLOWS
37
TRAFFICKERS, ORGANIZED CRIME AND THE BUSINESS OF EXPLOITATION
43
THE RESPONSE TO TRAFFICKING IN PERSONS
51
II.
REGIONAL OVERVIEWS
TRAFFICKING IN PERSONS IN EUROPE AND CENTRAL ASIA
59
TRAFFICKING IN PERSONS IN THE AMERICAS
70
TRAFFICKING IN PERSONS IN SOUTH ASIA, EAST ASIA AND THE PACIFIC
77
TRAFFICKING IN PERSONS IN AFRICA AND THE MIDDLE EAST
81
Text boxes
Origin or destination country?
25
Intimate and/or close family relationships and trafficking in persons offending
28
Towards a global victim estimate?
30
Recruitment through feigned romantic relationships
32
Trafficking in persons and armed conflicts
42
Confiscated assets and compensation of human trafficking victims
53
Do confraternities control the trafficking of Nigerian victims in Europe?
56
MAPS
MAP 1:
Share of foreign offenders among the total number of persons convicted of
trafficking in persons, by country,
2010-2012
24
MAP 2:
Share of children among the number of detected victims, by country,
2010-2012
33
MAP 3:
Countries that report forms of exploitation other than forced labour, sexual exploitation
or organ removal,
2010-2012
35
MAP 4:
Shares of detected victims who are trafficked into the given country from another
subregion,
2010-2012
39
MAP 5:
Shares of detected victims by subregional and transregional trafficking,
2010-2012
39


4
MAP 6:
Main destination areas of transregional trafficking flows (in blue) and their significant
origins,
2010-2012
40
MAP 7:
Citizenships of convicted traffickers in Western and Central Europe, by subregion,
shares of the total,
2010-2012 (or more recent)
60
MAP 8:
Origins of victims trafficked to Western and Central Europe, by subregion,
share of
the total number of victims detected there,
2010-2012
63
MAP 9:
Origins of victims trafficked to Western and Southern Europe, share of the total
number of victims detected there,
2010-2012 (or more recent)
63
MAP 10:
Origins of victims trafficked to Central Europe and the Balkans, share of the total
number of victims detected there,
2010-2012 (or more recent)
64
MAP 11:
Destinations of trafficking victims from Central Europe and the Balkans, as a
proportion of the total number of victims detected at specific destinations,
2010-2012
64
MAP 12:
Destinations of trafficking victims from Eastern Europe and Central Asia, as a
proportion of the total number of victims detected at destination,
2010-2012
69
MAP 13:
Origins of victims trafficked into North and Central America and the Caribbean,
shares of the total number of victims detected,
2010-2012 (or more recent)
73
MAP 14:
Destinations of trafficking victims originating in North and Central America and
the Caribbean, proportion of the total number of detected victims at destinations,
2010-2012 (or more recent)
74
MAP 15:
Origin of victims detected in South America, as a proportion of the total number
of victims detected in the subregion,
2010-2012 (or more recent)
75
MAP 16:
Destinations of trafficking victims originating in South America, proportion of the
total number of detected victims at destinations,
2010-2012 (or more recent)
76
MAP 17:
Destinations of trafficking victims originating in East Asia and the Pacific, proportion
of the total number of detected victims at destinations,
2010-2012 (or more recent)
79
MAP 18:
Destinations of trafficking victims originating in South Asia, proportion of the total
number of detected victims at destinations,
2010-2012
80
MAP 19:
Destinations of trafficking victims originating in West Africa, proportion of the total
number of detected victims at destinations,
2010-2012
83
MAP 20:
Destinations of trafficking victims originating in East Africa, proportion of the total
number of detected victims at destinations,
2010-2012
83
MAP 21:
Origins of victims trafficked to the Middle East, proportions of the total number of
victims detected there,
2010-2012
84
MAP 22:
Destinations of trafficking victims originating in North Africa, proportion of the
total number of detected victims at destinations,
2010-2012
85
GLOBAL REPOR
T ON
TRAFFICKING IN PERSONS
2014
5
CORE RESULTS
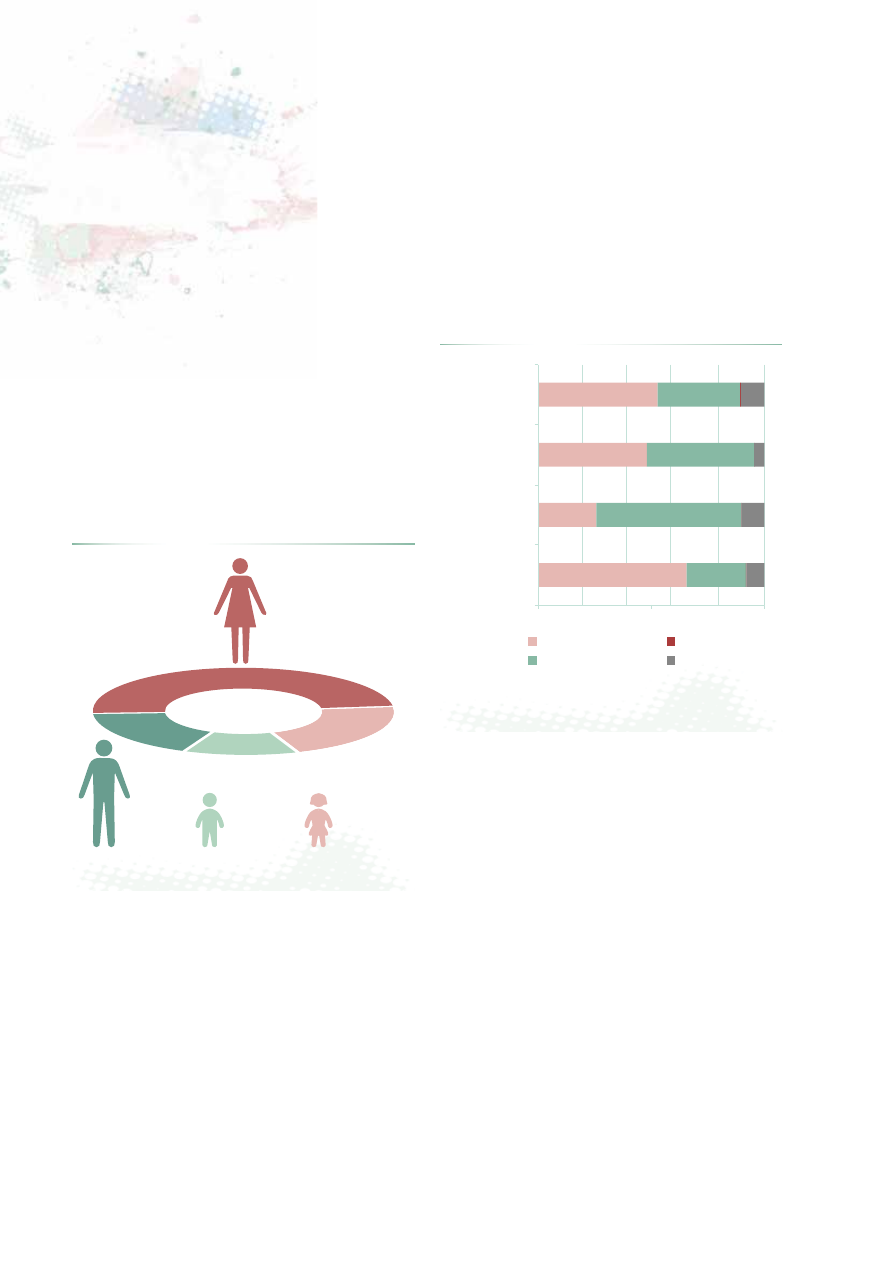
The data collection has revealed wide regional difference
with regard to the forms of exploitation (see figure).
•
Data coverage: 2010-2012 (or more recent).
•
Victims of 152 different citizenships have been
identified in 124 countries across the world.
•
At least 510 trafficking flows have been detected.
•
Some 64 per cent of convicted traffickers are citi-
zens of the convicting country.
•
Some 72 per cent of convicted traffickers are men,
and 28 per cent are women.
•
49 per cent of detected victims are adult women.
•
33 per cent of detected victims are children, which
is a 5 per cent increase compared to the 2007-2010
period.
Detected victims of trafficking in persons,
by age and gender,
2011
Source: UNODC elaboration on national data.
Forms of exploitation among detected
trafficking victims, by region of detection,
2010-2012 (or more recent)
Source: UNODC elaboration on national data.
0%
20%
40%
60%
80%
100%
Europe and
Central Asia
East Asia,
South Asia
and Pacific
Americas
Africa and
the Middle East
Sexual exploitation
Forced labour,
servitude and
slavery like
Organ removal
Other forms
of exploitation
53%
37%
10%
48%
47%
4%
26%
64%
10%
66%
26%
8%
WOMEN
49%
MEN
18%
BOYS
12%
GIRLS
21%