ВУЗ: Не указан
Категория: Не указан
Дисциплина: Не указана
Добавлен: 11.04.2021
Просмотров: 737
Скачиваний: 1
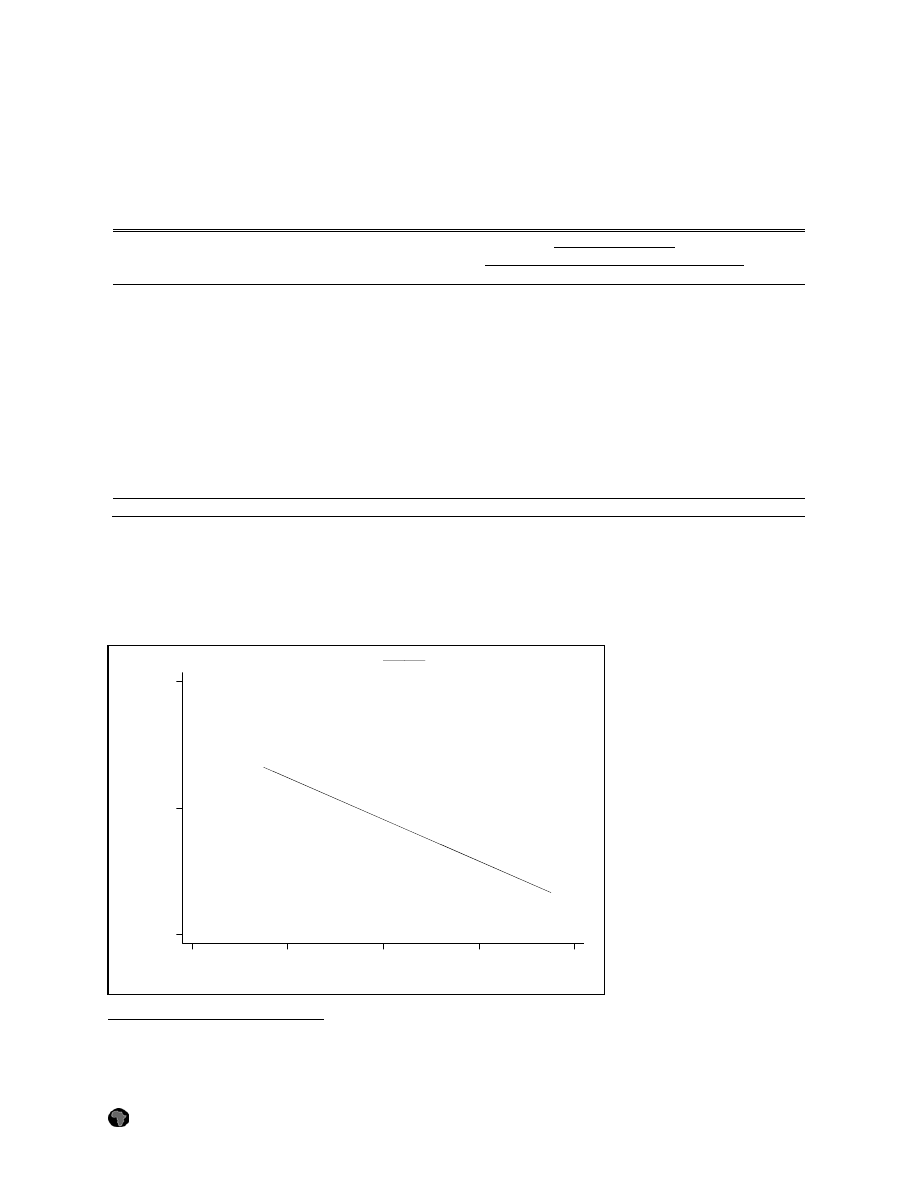
points, a very large effect (column 3). This finding is extremely robust: it holds under multiple measures
of ethnic diversity (see Table 5), when using the broader measure of ethnicity (see Appendix, Table A2),
and is not driven by any single country.
Figures 1 and 2 make clear graphically that no single country
drives the result.
Table 5: Sources of Ethnic Identity: Ethnic Diversity Measures
Dependent
variable:
Ethnic identity “describes respondent best”
(1) (2) (3) (4) (5) (6)
Ethnic fractionalization – Fearon measure
-0.83
**
(0.44)
-0.77
***
(0.24)
Ethnic fractionalization – Alesina measure
-0.67
**
(0.28)
Ethno-linguistic fractionalization
-1.02
***
(0.39)
Size of largest ethnic group
0.80
***
(0.19)
Politically relevant ethnic groups score
-1.10
***
(0.15)
Individual and country characteristics,
and country population weights
No Yes Yes Yes Yes Yes
Observations
(respondents)
14414 14414 14414 14414 14414 14414
Notes: Probit estimation, with marginal coefficient estimates (at mean values for the explanatory variables).
Huber robust standard errors in parentheses. Significantly different than zero at 90 percent (*), 95 percent (**),
99 percent (***) confidence. Regression disturbance terms are clustered at the country level. The individual and
country characteristics and weights are as in Table 4, regression 3.
Figure 1: Ethnic Identity “Describes Respondent Best” and Ethnic Fractionalization,
Fearon Measure (with fitted regression line)
Ethnic fractionalization, Fearon
Ethnic identity
Predicted values
.2
.4
.6
.8
1
0
.5
1
BOTSWANA
MALAWI
NAMIBIA
NIGERIA
S AFRICA
TANZANIA
UGANDA
ZAMBIA
ZIMBABWE
10
When countries are dropped one at a time, the coefficient estimate on ethnic fractionalization remains large,
negative and significant in all cases (regression not shown). This holds even for Botswana and Zambia, the two
apparent outliers in Figure 1.
9
Copyright Afrobarometer
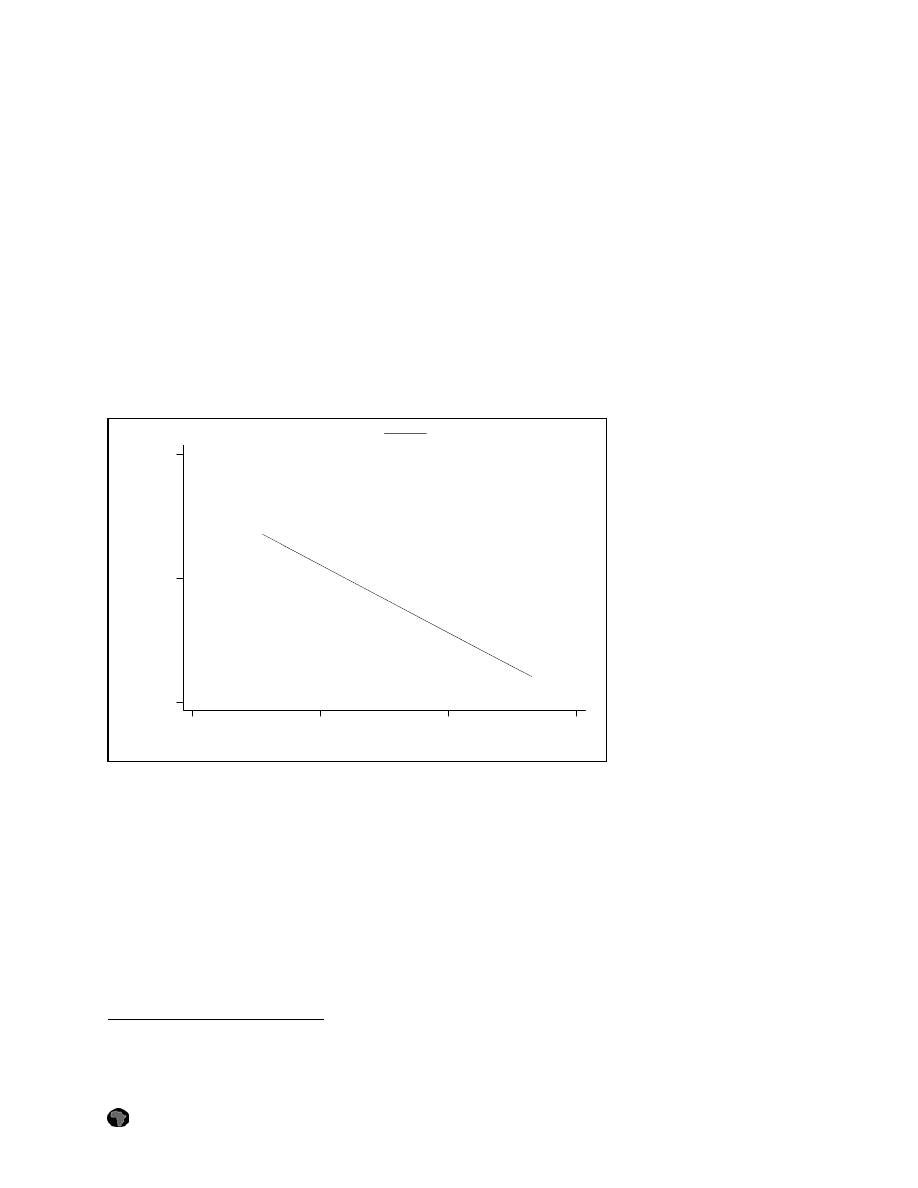
This empirical finding is consistent with theoretical claims advanced by Collier (2001) and Bates (2000)
regarding the relationship between ethnic diversity and politics. They argue that ethnic rivalries are likely
to be muted in highly diverse societies, since no single ethnic group is strong enough to attain power on
its own under such conditions and incentives will arise for cooperation across ethnic lines. At very low
levels of diversity, ethnicity will also not be salient for the simple reason that everyone is a member of the
same group. But as ethnic diversity increases from very lower levels to the middle of the range, ethnicity
will become more and more salient, as minority groups begin to challenge the dominant ethnic group for
power. Ethnicity becomes most salient in a situation where two more or less equally sized groups are
competing for power. Our empirical results, while consistent with this curvilinear hypothesis, do not
allow us to test it completely, since we do not have country observations in the relevant range: even the
most ethnically homogeneous societies in our nine-country sample (Botswana and Zimbabwe) are
reasonably ethnically diverse, with fractionalization measures in the 0.4 range (see Figures 1 and 2). So
our sample only allows us to capture the right (downward sloping) part of the curve.
Figure 2: Ethnic Identity “Describes Respondent Best” and Ethnic Fractionalization,
ELF Measure (with fitted regression line)
Ethno-linguistic fractionaliz.
Ethnic identity
Predicted values
.4
.6
.8
1
0
.5
1
BOTSWANA
MALAWI
NAMIBIA
NIGERIA
S AFRICA
TANZANIA
UGANDA
ZAMBIA
ZIMBABWE
A second central finding of our analysis is that the salience of ethnicity is closely related to the intensity
of political competition in the country in question. We find that the proximity of the timing of the
Afrobarometer survey to a national election is a highly significant explanatory variable: the closer the
survey is to an election (i.e., the greater the proximity), the more likely respondents are to respond that
they view themselves first and foremost in ethnic terms (Table 4, columns 2 and 3). The interpretation of
the electoral proximity coefficient is that, all else equal, a respondent in a country that is holding an
election at the time of the survey will be almost 30 percentage points more likely to identify him or
herself in ethnic terms than a respondent in a country whose election took place a year ago, or whose
election is scheduled to take place a year hence.
This finding has clear implications not just for the
sources of ethnic identification but also for the design and implementation of survey research, since
surveys conducted near election time appear to generate systematically different response patterns. As
11
There is no statistically significant difference between the effect of time since an election and time before an
election on the extent of ethnic identification (regression not shown), so we focus on a measure that treats time
before versus after an election symmetrically.
10
Copyright Afrobarometer
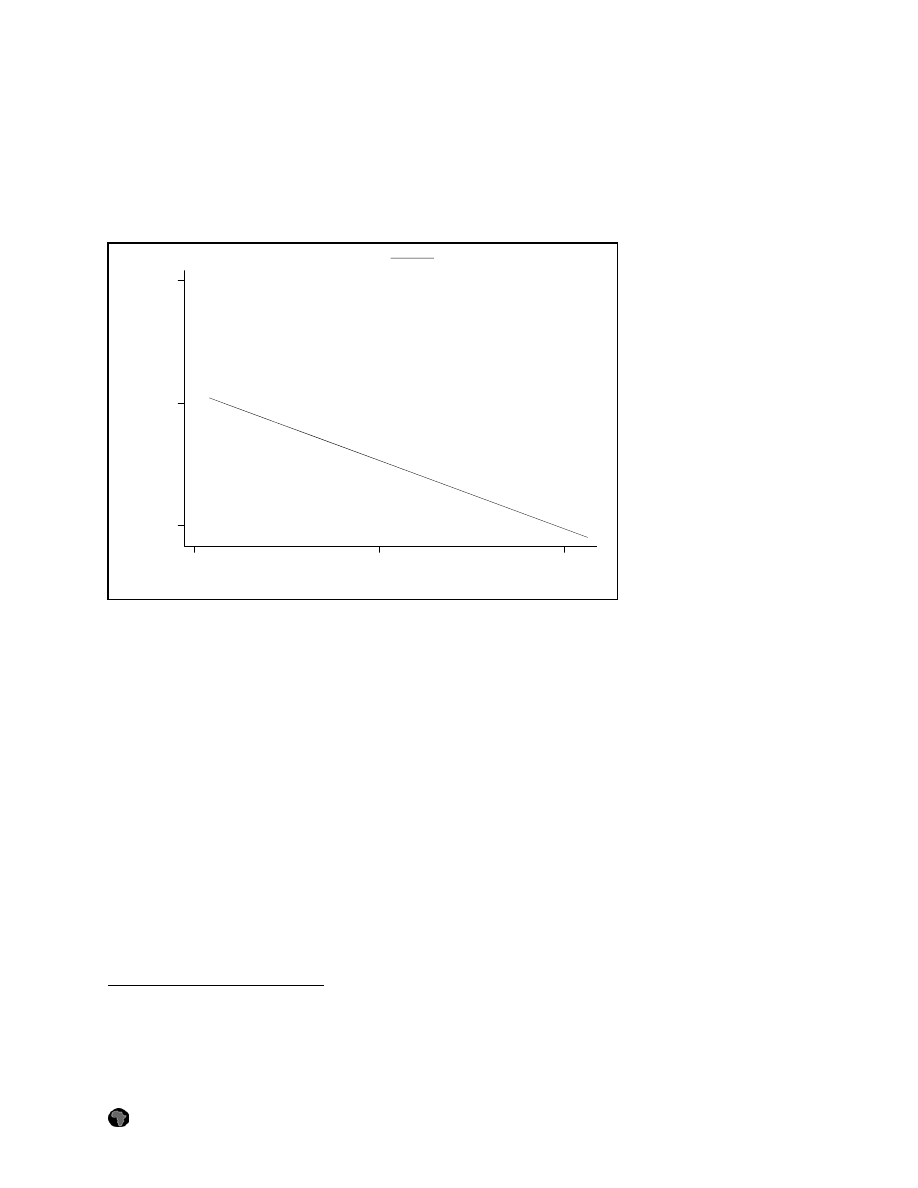
with the relationship between ethnic diversity and ethnic salience, the main result is robust to controlling
for the broader measure of ethnicity, and to the exclusion of individual characteristics, country
characteristics, and country population weights (see Appendix, Table A3). Figure 3 indicates that no
single country drives the finding.
Figure 3: Ethnic Identity “Describes Respondent Best” and Electoral Proximity
(with fitted regression line)
| Months pre/post election |
Ethnic identity
Predicted values
0
12
24
0
.5
1
BOTSWANA
MALAWI
NAMIBIA
NIGERIA
S AFRICA
TANZANIA
UGANDA
ZAMBIA
ZIMBABWE
Consistent with this result about the impact of electoral competition, we also find that a country’s average
Freedom House score (measuring political rights) over the last ten years is negatively related to the
salience of ethnicity in the country. Since Freedom House scores run backward – a score of 1 is awarded
for the highest levels of political freedoms; a score of 7 is given to the most closed and repressive regimes
– the interpretation of the political rights coefficient is that more open and vigorous political contestation
is associated with a more prominent place for ethnicity in people’s understandings of who they are. These
results provide strong empirical support for the modernization thesis that ethnic salience is a product of
increased political competition.
Ethnic Multidimensionality: Evidence from Kenya
To this point in the analysis, we have treated ethnicity as a unidimensional concept. Built right into our
coding procedures has been the assumption that while individuals may have multiple identities – such as
ethnicity, race, religion and occupation/class – their ethnic identities are singular: they either have them
(and rank them as most salient) or not. Yet abundant research (Mitchell 1956; Laitin 1986; Posner
forthcoming) suggests that this is simply not the case. Just as individuals possess repertoires of social
identities that include both ethnic and non-ethnic group memberships, they also possess multiple ethnic
identities: their language, their race, their tribe, and their sub-tribe, and, depending on whether or not one
12
We also explored the effects of socialist history and found it to be significant and negatively related to ethnic
salience (results not shown). Effectively, our “socialist history” variable amounted to a dummy variable for
Tanzania and Zambia. Our finding is almost certainly a product of the greater tendency of respondents in these
countries to answer the open-ended question about social identification in terms of occupation or class, and the
consequent effect this had on depressing ethnic responses.
11
Copyright Afrobarometer

admits them as “ethnic” – scholars disagree on this score – also their region, their religion, and their
nationality. Quite apart from the issue of whether ethnic identities trump non-ethnic ones, the question
therefore arises:
which
ethnic identity is most salient, and under what conditions?
To better understand the conditions under which particular dimensions of ethnic identity become salient,
we collected original survey data in Kenya that would allow us to investigate the relative salience of tribal
and sub-tribal ethnic identifications. Tribal and sub-tribal identities are only two of the multiple ethnic
identities that most Kenyans have in their identity repertoires. But by exploring the factors that
predispose respondents to identify themselves in terms of one rather than the other, we can begin to
investigate the conditions under which some ethnic identities become salient rather than others.
Data and Measurement
Data collection was carried out in the main markets of two Kenyan towns: Chwele and Eldoret. Chwele
is a small rural town in Kenya’s Western Province; Eldoret, located in Rift Valley Province, is the sixth
largest town in Kenya and a regional center for trade. Enumerators from ICS Africa, a Dutch non-
governmental organization that works in nearby districts, carried out the data collection, with the support
of local government officials. Surveys were administered in January and February 2003 to 1849
individuals who were randomly sampled from every fifth person working and shopping in the markets.
Respondents were given a small gift in appreciation for their participation.
Questions about respondents’ ethnic identifications were couched in a larger survey about how often
respondents came to the market and what they were buying or selling. The survey also collected
information about respondents’ gender, age, education level, religion, and home area. We asked two
questions regarding ethnicity. First, we asked an open-ended question: “What is your tribe or sub-tribe?”
Enumerators recorded all answers that respondents provided and noted the answer (tribe or sub-tribe) they
mentioned first. Then we asked a close-ended question: “A moment ago, you said that you were
[occupation], [religion], [tribe], and [sub-tribe]. Which of these do you think describes you best?”
Although not identical, the phrasing of this second question is very similar to the standard Afrobarometer
question employed in the first part of this paper.
Unlike the data from the Afrobarometer surveys, the data from our market surveys in Chwele and Eldoret
is not nationally representative. The market setting distinguishes the respondents from the national
population in terms of occupation (which was more likely to be business- or trade-related), degree of
social interaction (which was almost certainly higher than the median resident in the country), and
urban/rural location (which was neither as rural as experienced by most Kenyans nor as urban as
experienced by others). Given that the survey was conducted in just two relatively proximate locations,
our sample is also not nationally representative in terms of tribe or religion. Finally, the fact that many of
the respondents were interviewed in their places of business may have influenced responses, particularly
since “occupation” was an option for the identity that described them best. Descriptive statistics for the
sample are provided in Table 6.
When respondents were asked about the salience of ethnic identity compared with other attributes – a
question analogous to the one asked in the Afrobarometer survey – only 12 percent of respondents said
that ethnic identity described them best. This figure is low when compared to the Afrobarometer average,
but is similar to the results for neighboring Uganda (13 percent). It is also very close to the results from
the Kenya survey from Round 2 of the Afrobarometer project, where 13 percent of respondents identified
in ethnic terms.
The breakdown of responses across all identity categories is also similar to that found
in the Round 1 Afrobarometer surveys in Zambia and Uganda, where, as in our Kenya sample,
13
Although Round 2 Kenya data have unfortunately not yet been released to the public, certain summary statistics
are provided in Wolf,
et al.
(2004).
12
Copyright Afrobarometer

approximately 7-13 percent of respondents describe themselves in ethnic terms, about a third in religious
terms, and about half in class/occupational terms.
Table 6: Descriptive Statistics (for Kenya Market Survey Analysis)
Variable
Mean Std.
dev.
Obs.
Named sub-tribe (not tribe) first when asked for ethnic identity, Kalenjins and Luhyas
0.51
0.50
1186
Named sub-tribe (not tribe) first when asked for ethnic identity, Kalenjins only
0.53
0.50
509
Ethnic identity “describes respondent best”
0.12
0.32
1186
Religious identity “describes respondent best”
0.33
0.47
1186
Occupation identity “describes respondent best”
0.53
0.50
1186
Other identity “describes respondent best”
0.02
0.12
1186
Female
0.53 0.50 1186
Age (years)
35.6
10.2
1186
No formal education
0.02
0.14
1186
Some primary education
0.20
0.40
1186
Completed primary education
0.31
0.46
1186
Some secondary education
0.17
0.37
1186
Completed secondary education
0.22
0.42
1186
At least some post-secondary education
0.08
0.28
1186
Occupation: Farming or fishing
0.40
0.49
1186
Occupation: White collar, teacher, or government employee 0.10
0.29
1186
Occupation: Blue collar or miner
0.11
0.31
1186
Occupation: Student
0.02
0.13
1186
Occupation: Business, shop keeper, or petty trader
0.72
0.45
1186
Occupation: Other (e.g., unemployed, housewife, don’t know)
0.05
0.22
1186
Rural data collection site (Chwele)
0.41
0.49
1186
Listens to radio daily
0.79
0.41
1186
Reads the newspaper at least weekly
0.55
0.50
1186
Kalenjin ethnic group (tribe)
0.43
0.50
1186
Keiyo sub-tribe
0.11
0.31
1186
Kipsigis sub-tribe
0.03
0.16
1186
Marakwet sub-tribe
0.06
0.23
1186
Nandi sub-tribe
0.12
0.33
1186
Sabaot sub-tribe
0.07
0.26
1186
Tugen sub-tribe
0.02
0.15
1186
Notes: The education categories are mutually exclusive. The occupation categories are not mutually exclusive,
unlike in Afrobarometer. We restrict attention in the Kenya analysis to individuals from the Kalenjin and Luhya
ethnic groups, since the question of tribe versus sub-tribe identity is only relevant for them.
However, the Kenya results also deviate from Round 1 Afrobarometer findings in some ways. For
example, in the Kenya data, older respondents are significantly less likely to say their ethnicity described
them best, while in the Afrobarometer data age is positive and significantly related to ethnic
identification. Individuals in the occupational categories “white collar, teacher or government employee”
and “business, shop-keeper or petty trader” are significantly less likely to identify ethnically in the Kenya
data, unlike in the Afrobarometer data.
Structural Sources of Tribal and Sub-tribal Identifications
We limit our analysis of the sources of tribal and sub-tribal identification to the 1,186 respondents who
identified themselves as members of the Kalenjin or Luhya ethnic groups. In addition to being the two
largest ethnic groups in Chwele and Eldoret, the Luhya and Kalenjin groups are both umbrella categories
13
Copyright Afrobarometer