ВУЗ: Не указан
Категория: Не указан
Дисциплина: Не указана
Добавлен: 13.10.2020
Просмотров: 1640
Скачиваний: 1
Global overview
I
37
forms other than sexual exploitation, forced labour or
organ removal has increased from 3 per cent in 2006 to
6 per cent in 2010 and 7 per cent in 2011 worldwide.
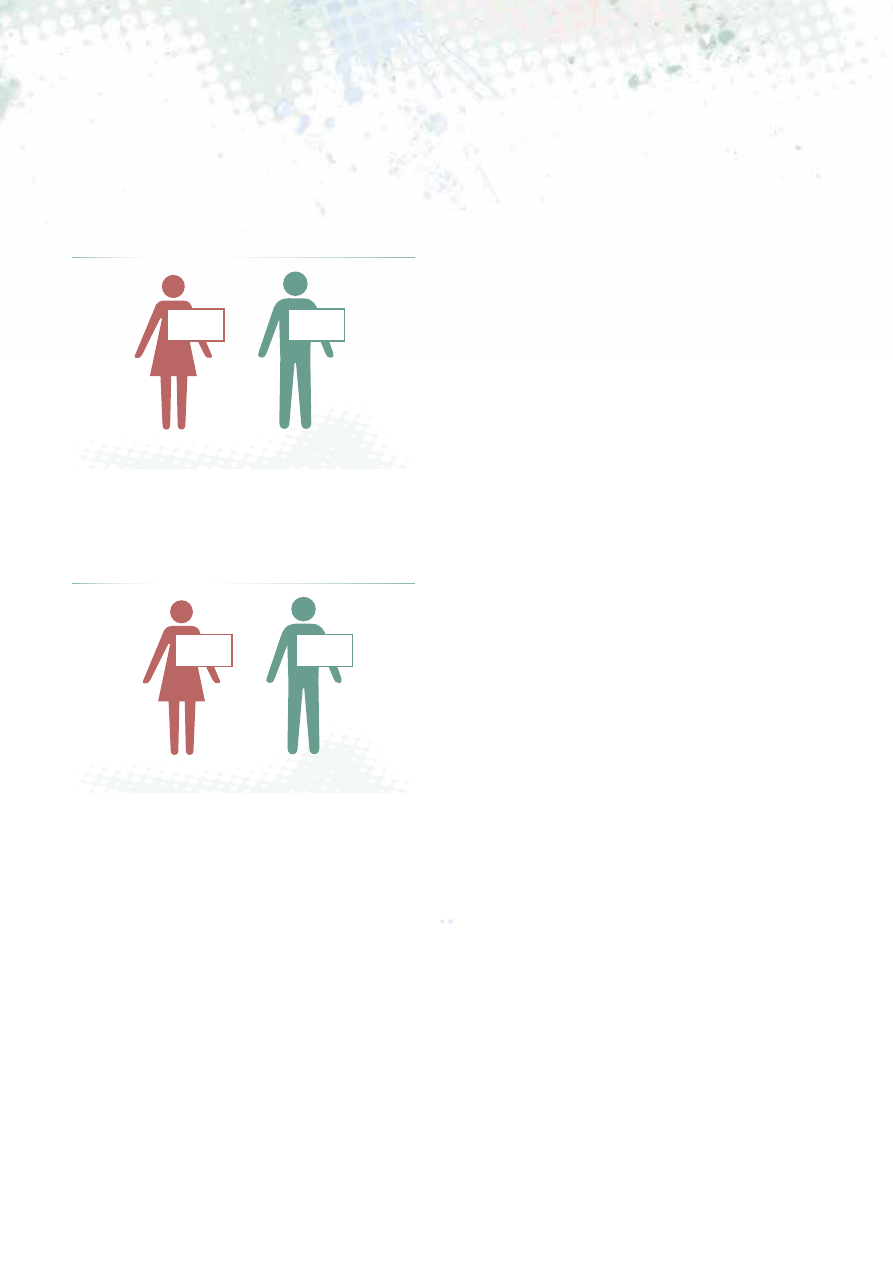
Between 2010 and 2012, some 60 per cent of the victims
falling into this category were women or girls. The broad
’other forms’ category includes very different types of traf-
ficking in persons that often involve victims with different
profiles. Trafficking for forced armed combat - or child
soldiers - targets mainly boys. Mixed forms of labour and
sexual exploitation mainly affects women, whereas forced
marriages usually involve victims that are girls or young
women. Trafficking for begging and/or committing petty
crime mainly involves children, both girls and boys, as
does trafficking for the production of pornographic mate-
rial. For some other forms of exploitation, including for
fraudulent state benefit claims and other purposes not
listed here, the profile information is not known.
TRAFFICKING FLOWS
Trafficking in persons is a crime of global scope that leaves
virtually no country unaffected. An analysis of the geo-
graphic dimension of this crime, that is, where victims are
trafficked to and from, can help in identifying and moni-
toring acute situations and inform the prioritization of
anti-trafficking efforts. Information regarding the citizen-
ships of detected victims in their destination countries is
crucial for mapping the trafficking flows, and many
Member States were able to provide such information to
UNODC. In addition, data regarding the destination
countries of victims who have been repatriated to their
own (origin) countries can also shed light on trafficking
flows. Analyses stemming from such data is presented
separately.
Information regarding the citizenships of victims was pro-
vided by 83 countries. It refers to a total of 27,052 victims
of trafficking in persons detected between 2010 and 2012
(or more recently) whose citizenship was reported. With
regard to repatriation, information was provided by 35
countries, covering 4,441 own citizens (relative to the
reporting countries) who had been repatriated by other
countries where they had been detected as victims of
trafficking.
The broad geographical dispersion of victim detections is
well known. Between 2010 and 2012, victims with 152
citizenships were detected in 124 countries across the
world. At least 510 trafficking flows
13
were detected glob-
ally. This should be considered an absolute minimum as
it is based on official data reported to UNODC which
does not include the hidden cases of trafficking; the actual
number of flows is likely to be significantly higher.
Victims can be trafficked either domestically (within the
borders of one country
14
) or transnationally (crossing at
13 Defining a ‘flow’ as one origin country and one destination country
with at least five detected victims during the 2010-2012 reporting
period. This also includes the case of domestic trafficking in which
the country of origin and destination coincide.
14 Transnationality is not a requirement for establishing a traffick-
ing in persons offence. The Legislative Guides to the Trafficking in
Persons Protocol (and the Convention against Transnational Organ-
ized Crime, which the Protocol supplements) state that ‘It must
be strongly emphasized that, while offences must involve transna-
tionality and organized criminal groups for the Convention and its
international cooperation provisions to apply, neither of these must
be made elements of the domestic offence.’ (
UNODC, Legislative
Guides for the implementation of the United Nations Convention against
Organized Crime and the Protocols thereto
, Section A, Implementation
of the Protocol, Article 18.) Domestic trafficking in persons cases are
reported by most of the countries that submit data to UNODC.
FIG. 20:
Gender breakdown of detected
victims of trafficking for sexual
exploitation,
2010-2012 (or more
recent)
Source: UNODC elaboration on national data.
FIG. 21:
Gender breakdown of detected
victims of trafficking for ‘other’
forms of exploitation than forced
labour,
sexual exploitation or organ
removal,
2010-2012 (or more recent)
Source: UNODC elaboration on national data.
97
%
3
%
73
%
27
%

GLOBAL REPOR
T ON
TRAFFICKING IN PERSONS
2014
38
least one border between different countries). About 70
per cent of the detected victims over the 2010-2012 period
were trafficked cross-border. However, only 27 per cent
of the total number of victims experienced transregional
trafficking; that is, being trafficked from one region to
another. While most detected cases of trafficking are trans-
national – meaning that they implicate more than one
country and at least one border crossing - they are usually
also of limited geographical reach (they often happen
within the same subregion).
As will be discussed later in the section on
Traffickers,
organized crime and the business of exploitation
, intrare-
gional trafficking – which is the most commonly detected
type - often sees victims from relatively poorer countries
within a given geographical area being exploited in rela-
tively richer ones. Similarly, although UNODC does not
collect this information systematically, information from
the court cases submitted by Member States suggests that
domestic trafficking often involves victims from relatively
poorer areas of the given country trafficked for exploita-
tion into more affluent areas; often the capital or another
large city.
Transregional trafficking comprises about 27 per cent of
the total number of detected trafficking flows, and these
flows provide the clearest illustration of the distinctions
between origins and destinations. Victims of this type of
trafficking are more often detected in the affluent areas of
the Middle East, Western Europe and North America,
although there are also some transregional trafficking flows
with destinations in other areas.
A key feature of transregional trafficking is the complexity
of carrying it out. To traffic someone across continents,
offenders generally need valid passports, visas or other
permits to allow entry into the destination country, inter-
national transportation, local transportation in both the
sending and receiving countries, lodging, supervision of
the victim during the travel and a way to collect and con-
trol the victim upon arrival at destination, before the
exploitation commences. While it may be possible for a
single offender to traffic one or two victims alone, it is
often necessary to involve others to varying extents. Set-
ting up a transregional trafficking operations also often
require more skills and capital than starting a more geo-
graphically confined scheme.
In one court case, submitted by the United States of Amer-
ica, an Eastern European criminal group with at least five
members (who were brothers) trafficked victims from their
country into the United States and exploited them in
forced labour. The traffickers evaded US visa requirements
by having the victims travel to a neighbouring country on
tourist visas and then arranging for them to be smuggled
into the United States. Once in the United States, the
victims had to be transported, lodged and controlled.
Their passports were taken away and they were made to
work as cleaners and janitors in various large commercial
properties. While such a trafficking operation may gener-
ate considerable profits, it also requires a lot of skills, capi-
tal and labour to set up and run. Two of the group
members have so far been convicted; one received a prison
sentence of life plus 20 years, and the other, 20 years’
imprisonment.
Domestic trafficking, on the other hand, tends to require
less preparation and organization. There is no need for
travel documents and costly flight tickets, and transport
– if necessary – can often be easily arranged by private car.
Moreover, traffickers may not need to acquire special lodg-
ing for the victims as they may use their own residence or
place of business. There were several instances of such
arrangements in the court cases, for example, one case
from El Salvador where a woman was convicted of traf-
ficking one girl for sexual exploitation. The girl was
recruited with a promise of cashier work in the offender’s
shop, but was instead locked up in the shop, threatened,
starved and forced to drink alcohol in order for men to
exploit her sexually against payment to the trafficker. In
comparison to the transregional trafficking operation
described above, the preparation and management in this
case is minimal, but the profit potential also pales in com-
FIG. 22:
Breakdown of trafficking flows
by geographical reach,
2010-2012
(or more recent)
Source: UNODC elaboration on national data.
TRANSREGIONAL
26%
CROSS-BORDER WITHIN
SAME SUBREGION
37%
DOMESTIC
(WITHIN NATIONAL BORDERS)
34%
FROM NEARBY
SUBREGION
3%

Global overview
I
39
Sciences Po - Atelier de cartographie, 2014
countries not covered
Share of detected victims from other subregions
data not available
subregions used in the report
0
2
20
60
100
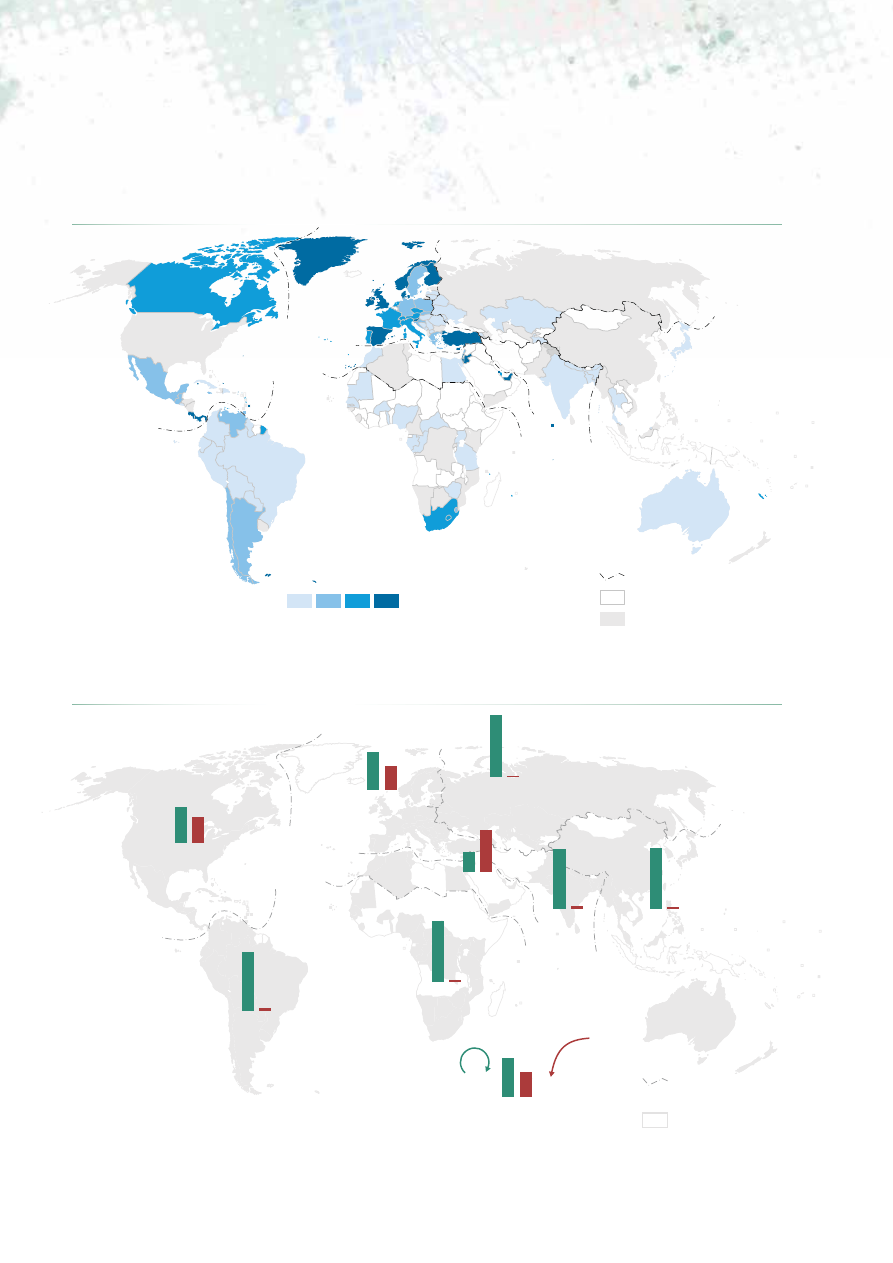
MAP 4:
Shares of detected victims who are trafficked into the given country from another
subregion,
2010-2012
Source: UNODC.
Note: The boundaries shown on this map do not imply official endorsement or acceptance by the United Nations. Dashed lines represent undetermined
boundaries. The dotted line represents approximately the Line of Control in Jammu and Kashmir agreed upon by India and Pakistan. The final status of
Jammu and Kashmir has not yet been agreed upon by the parties. The final boundary between the Sudan and South Sudan has not yet been determined.
MAP 5:
Shares of detected victims by subregional and transregional trafficking,
2010-2012
Source: UNODC.
Note: The boundaries shown on this map do not imply official endorsement or acceptance by the United Nations. Dashed lines represent undetermined
boundaries. The dotted line represents approximately the Line of Control in Jammu and Kashmir agreed upon by India and Pakistan. The final status of
Jammu and Kashmir has not yet been agreed upon by the parties. The final boundary between the Sudan and South Sudan has not yet been determined.
from outside
the subregion
within
the subregion
or country
Sciences Po - Atelier de cartographie, 2014
countries not covered
subregions
used in the report
North America,
Central America
and the Caribbean
South
America
Western
and Central Europe
Eastern Europe
and Central Asia
North Africa and
the Middle East
Sub-Saharan
Africa
South
Asia
East Asia
and the Pacific
39%
61%
1%
99%
4%
96%
3%
97%
6%
94%
42%
58%
3%
97%
68%
32%
GLOBAL REPOR
T ON
TRAFFICKING IN PERSONS
2014
40
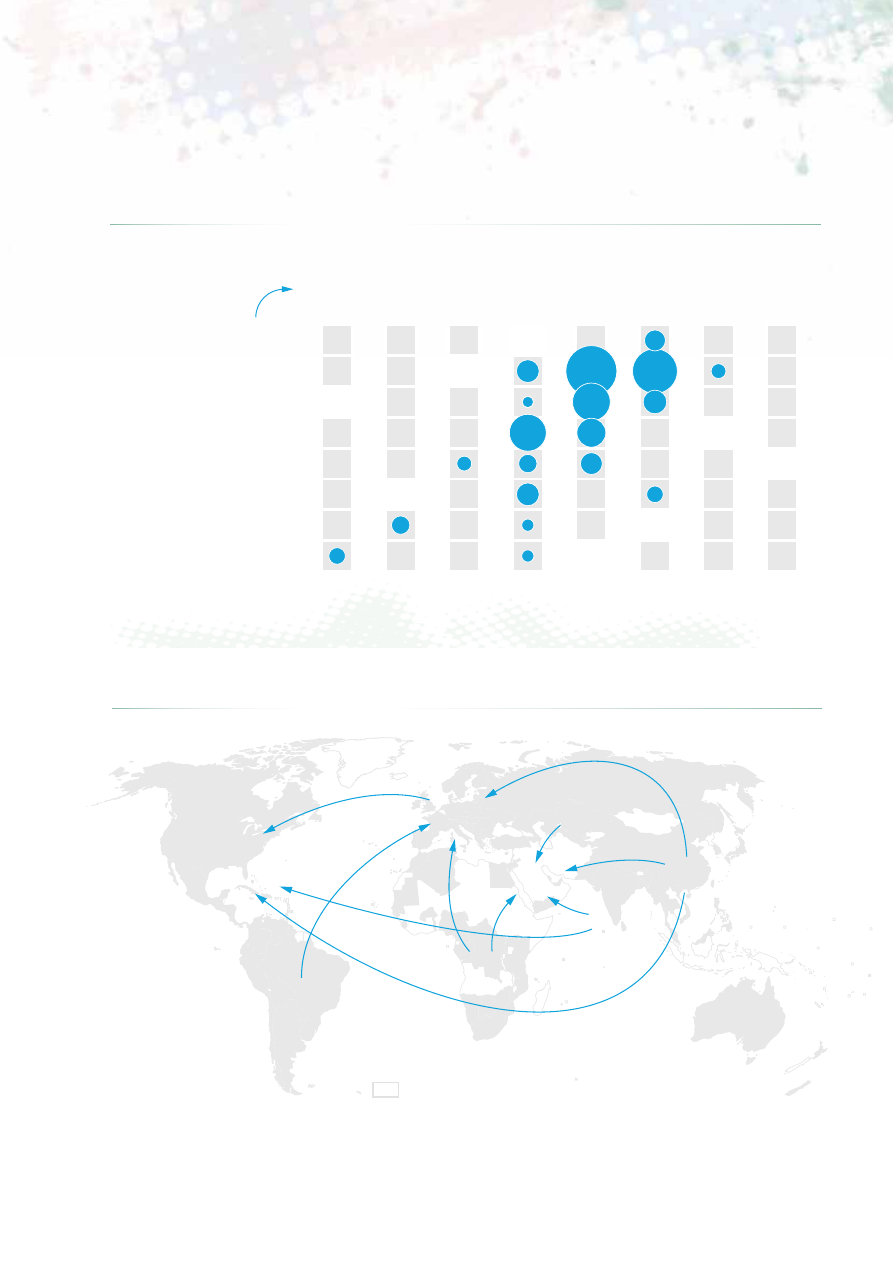
FIG. 23:
Citizenships of foreign victims,
by subregion, shares of the total number of detected
victims,
2010-2012
Source: UNODC elaboration on national data.
MAP 6:
Main destination areas of transregional trafficking flows (in blue) and their significant
origins,
2010-2012
Source: UNODC.
Note: The boundaries shown on this map do not imply official endorsement or acceptance by the United Nations. Dashed lines represent undetermined
boundaries. The dotted line represents approximately the Line of Control in Jammu and Kashmir agreed upon by India and Pakistan. The final status of
Jammu and Kashmir has not yet been agreed upon by the parties. The final boundary between the Sudan and South Sudan has not yet been determined.
East
Asians
South
Americans
Sub-Saharan
Africans
Eastern
and Central
Europeans
South
Asians
Western
and Central
Europe
North America,
Central America
and the Caribbean
The Middle
East
Sciences Po - Atelier de cartographie, 2014
countries not covered
The arrows show the flows that represent 5% and above
of the total victims detected in destination subregions
Share of the nationalities of victims
to total victims detected
in destination subregions
Note: the values below 1% are not shown.
in
East
Asia
in
South
Asia
in
Sub-
Saharan
Africa
in the
Middle
East,
North
Africa
in
North,
Central
America
and the
Caribbean
in
South
America
in
Eastern
Europe,
Central
Asia
in
Western,
Central
Europe
East Asians
South Asians
SubSaharan Africans
North Africans and Middle Easterns
N&C Americans and Caribic
South Americans
Eastern Europens and Central Asians
Western and Central Europeans
6%
25%
33%
3%
1%
7%
18%
17%
10%
6%
3%
2%
4%
4%
6%
2%
2%
3%
5%
Global overview
I
41
parison. The investments of traffickers into the trafficking
process seem to be related to the expected profits as the
traffickers aim at maximizing their return – as in any other
business.
Looking specifically at transregional trafficking, the
Middle East
15
registers the highest share of inbound traf-
ficking from other regions. More than half of the victims
detected in that area were trafficked from other regions.
For Western and Central Europe and North and Central
America and the Caribbean, this was true for about 40
per cent of the detected victims. The origins of victims
involved in transregional trafficking flows are also very
diverse, with victims coming from countries in most other
regions.
The other regions and subregions are very different and
hardly report transregional trafficking. The shares of
domestic and intraregional trafficking in these regions are
above 95 per cent. While there are relatively small shares
of victims trafficked in from other regions in some of these
countries, the overwhelming majority of the victims
detected in East Asia are citizens of other East Asian coun-
tries, in South Asia they are mainly South Asians, in Africa
they are generally Africans and so forth.
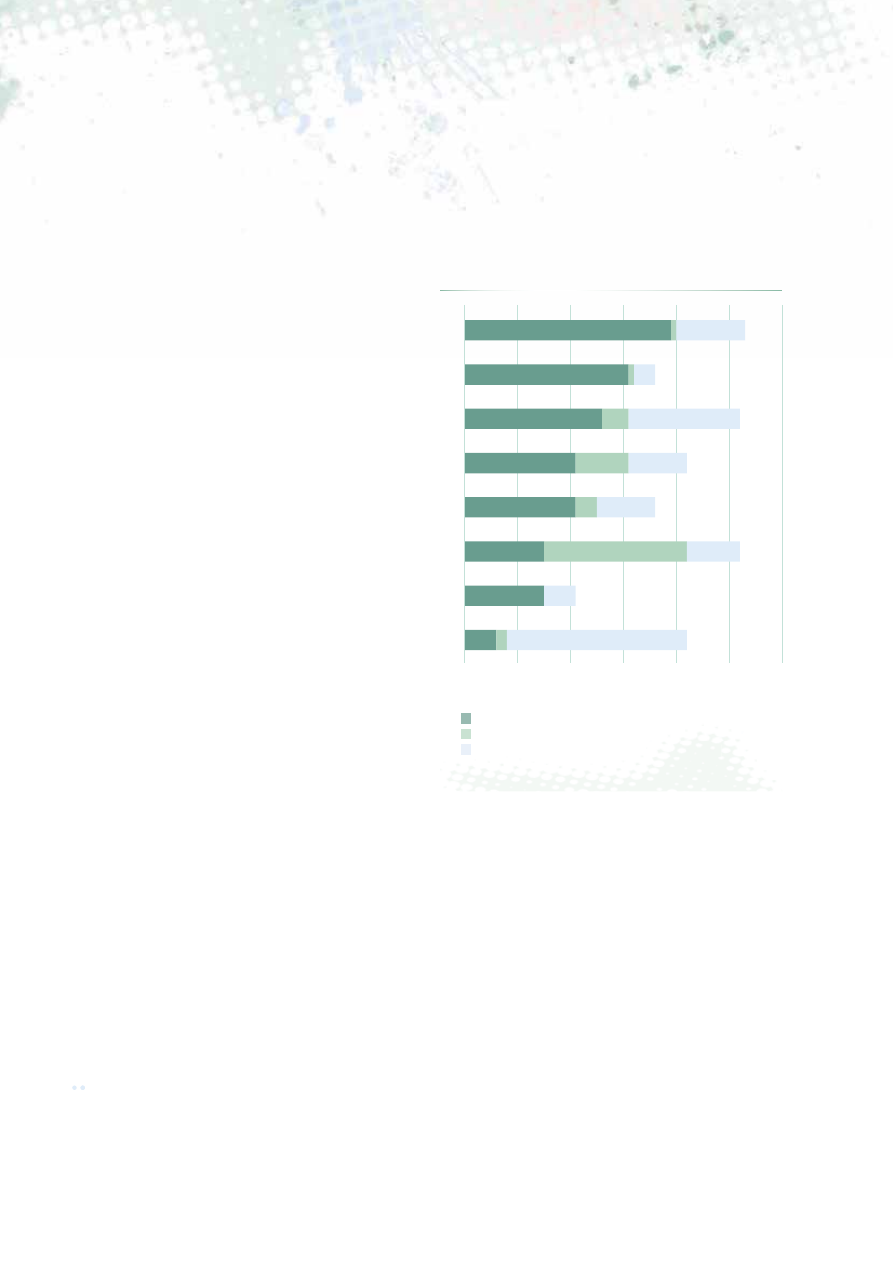
Considering the dispersion of victims from different areas,
it is clear that some origin areas have a global dimension,
where victims from that particular area are trafficked
widely across the world. Other areas are more regional,
and some predominantly domestic. East Asian victims
belong in the first category.
Victims from East Asia have been detected in all regions
and subregions of the world; often in significant numbers.
East Asians – particularly South-East Asians – have been
detected in and/or repatriated from the most geographi-
cally dispersed set of destination countries of any geo-
graphical aggregation of victims. This is largely because
East Asian victims have been detected in and/or repatri-
ated from the highest number of destination countries
outside that region, particularly in North America, the
Middle East and Western and Central Europe.
Victims from the subregion of Eastern Europe and Cen-
tral Asia have also been detected in and/or repatriated
from a large number of countries. The difference is that
victims from Eastern Europe and Central Asia are mainly
15 While the Middle East is part of the broader subregion of North
Africa and the Middle East, the data from North Africa is extremely
scarce. Therefore, the information on trafficking flows in this subre-
gion refers near exclusively to the Middle East.
detected within the broader region of Europe and Central
Asia. Only a limited number of countries outside Europe
report detecting victims who are citizens of countries in
Eastern Europe and Central Asia, which means that traf-
ficking originating in this area is highly relevant and
widely spread across Europe, whereas East Asian traffick-
ing is also transregional.
In addition to East Asia, other significant origin areas for
transregional trafficking flows are South Asia (widely
detected in the Middle East and North America), Sub-
Saharan Africa (detected in Western and Central Europe)
and South America (detected in Western and Central
Europe, as well as in North and Central America). As
previously mentioned, in Eastern Europe and Central
Asia, South Asia, East Asia and the Pacific, South America
and Sub-Saharan Africa, victims from outside the region
in question are rarely detected.
0
10
20
30
40
50
60
EAST ASIA
SOUTH ASIA
SUB-SAHARAN AFRICA
SOUTH AMERICA
NORTH AND CENTRAL AMERICA AND CARIBBEAN
EASTERN EUROPE AND CENTRAL ASIA
NORTH AFRICA AND MIDDLE EAST
WESTERN AND CENTRAL EUROPE
Number of countries in other regions
Number of countries in the nearby subregion
Number of countries in the same subregion
SUBREGION OF ORIGIN
Number of countries where these victims have been detected
Number of countries in other regions
Number of countries in the nearby
y
su
su
u
bre
bre
re
gio
gio
gio
n
n
n
Number of countries in the
e
sam
m
e s
e s
e s
s
ubr
ubr
ubr
ubr
eg
egion
on
o
n
Number of countries where these victims have been detected
FIG. 24:
Diffusion of trafficking flows within
and out of the subregion of origin
(number of countries where citizens
of countries in the given subregions
were detected),
2010-2012 (or more
recent)
Source: UNODC elaboration on national data.